Activity: Explore dashboards and metrics
Module 3
Red Hat Connectivity Link provides a variety of starting points for monitoring your installation in the Kuadrant upstream project (examples from kuadrant.io) folder. These dashboards and alerts are ready-to-use and easily customizable to fit your environment.
| If an image is too tiny, click to view it full screen. |
Login to Grafana
-
Navigate to the Grafana dashboards by clicking here
-
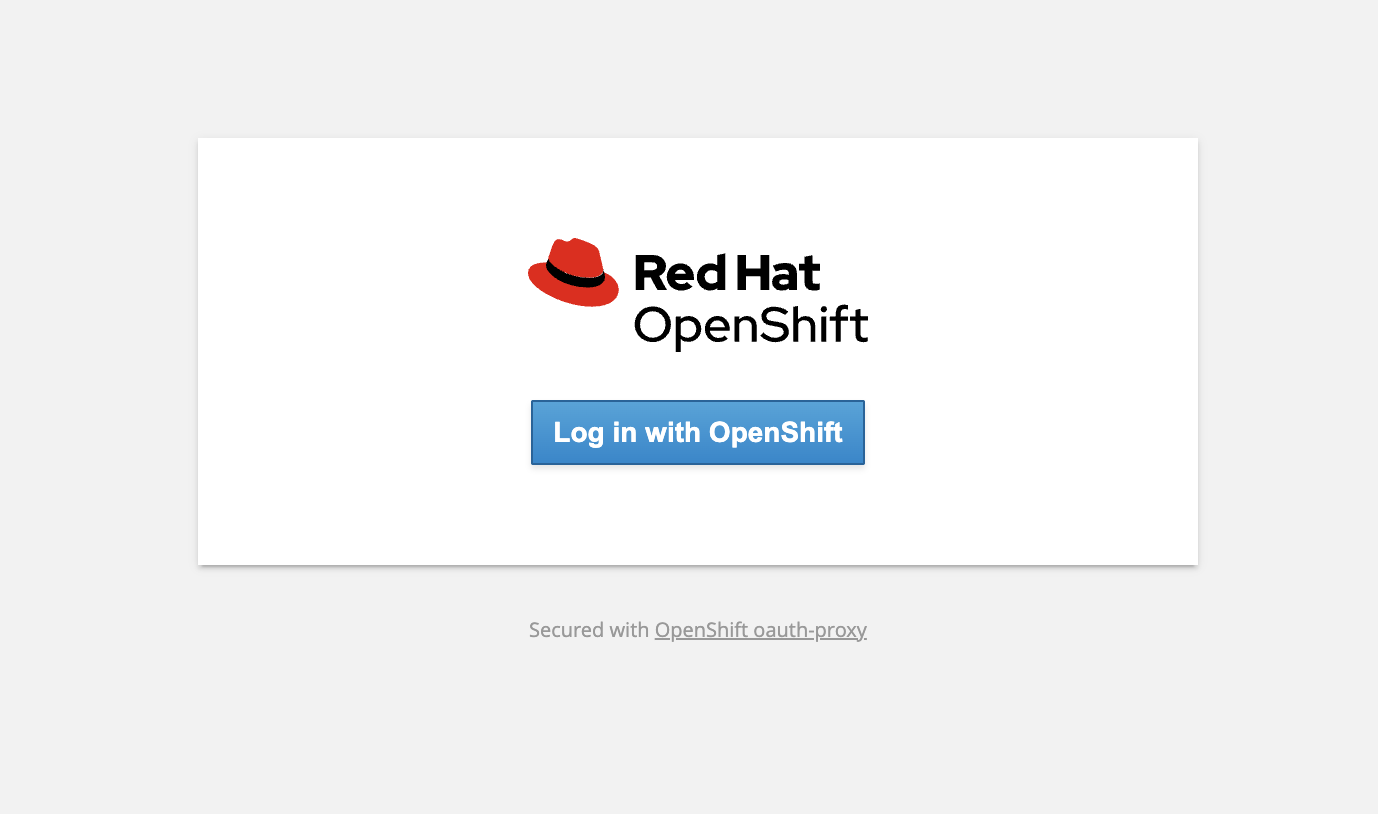
Click on the Log in with OpenShift button, and log in with username
adminand password{ocp_cluster_openshift_cluster_admin_password}when prompted.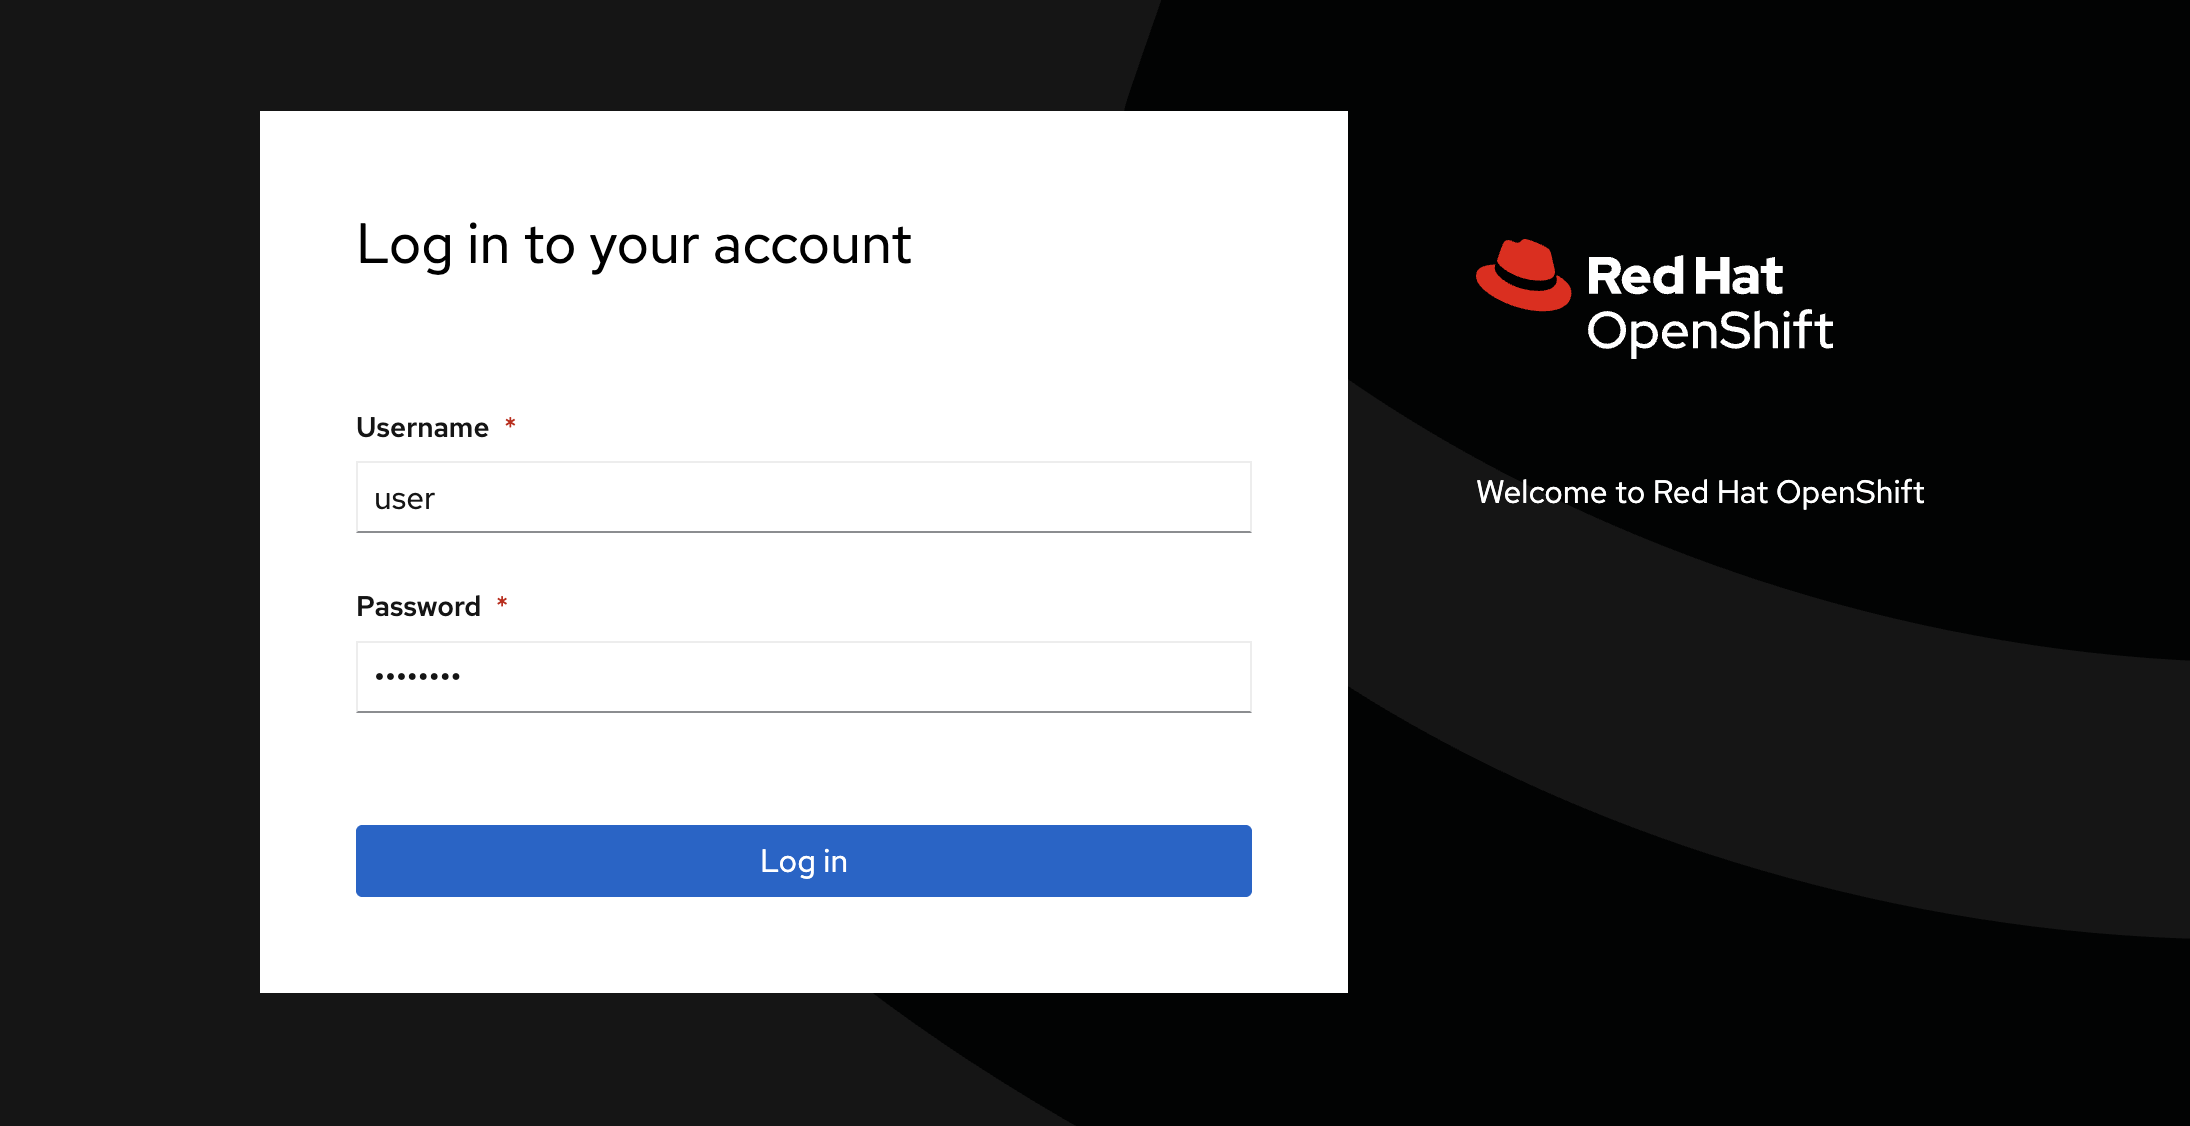
-
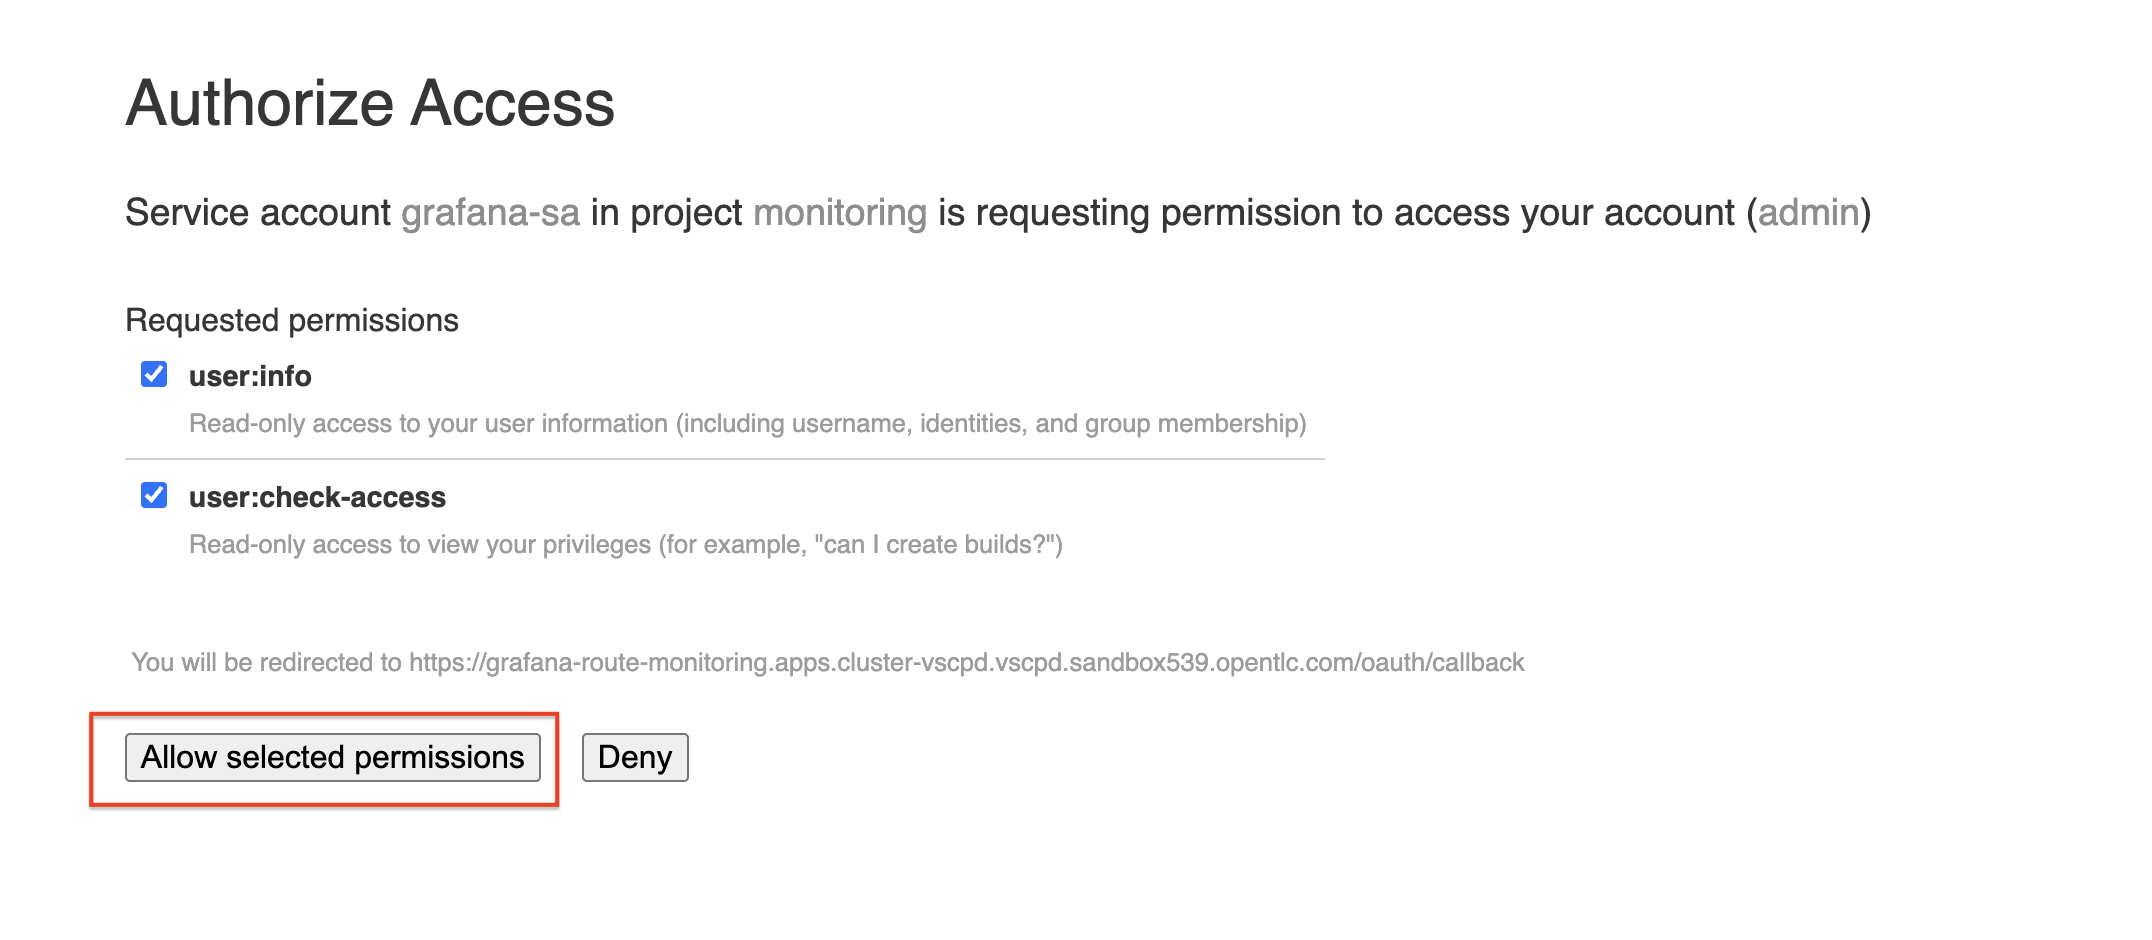
Click Allow selected permissions button
Access the dashboards
-
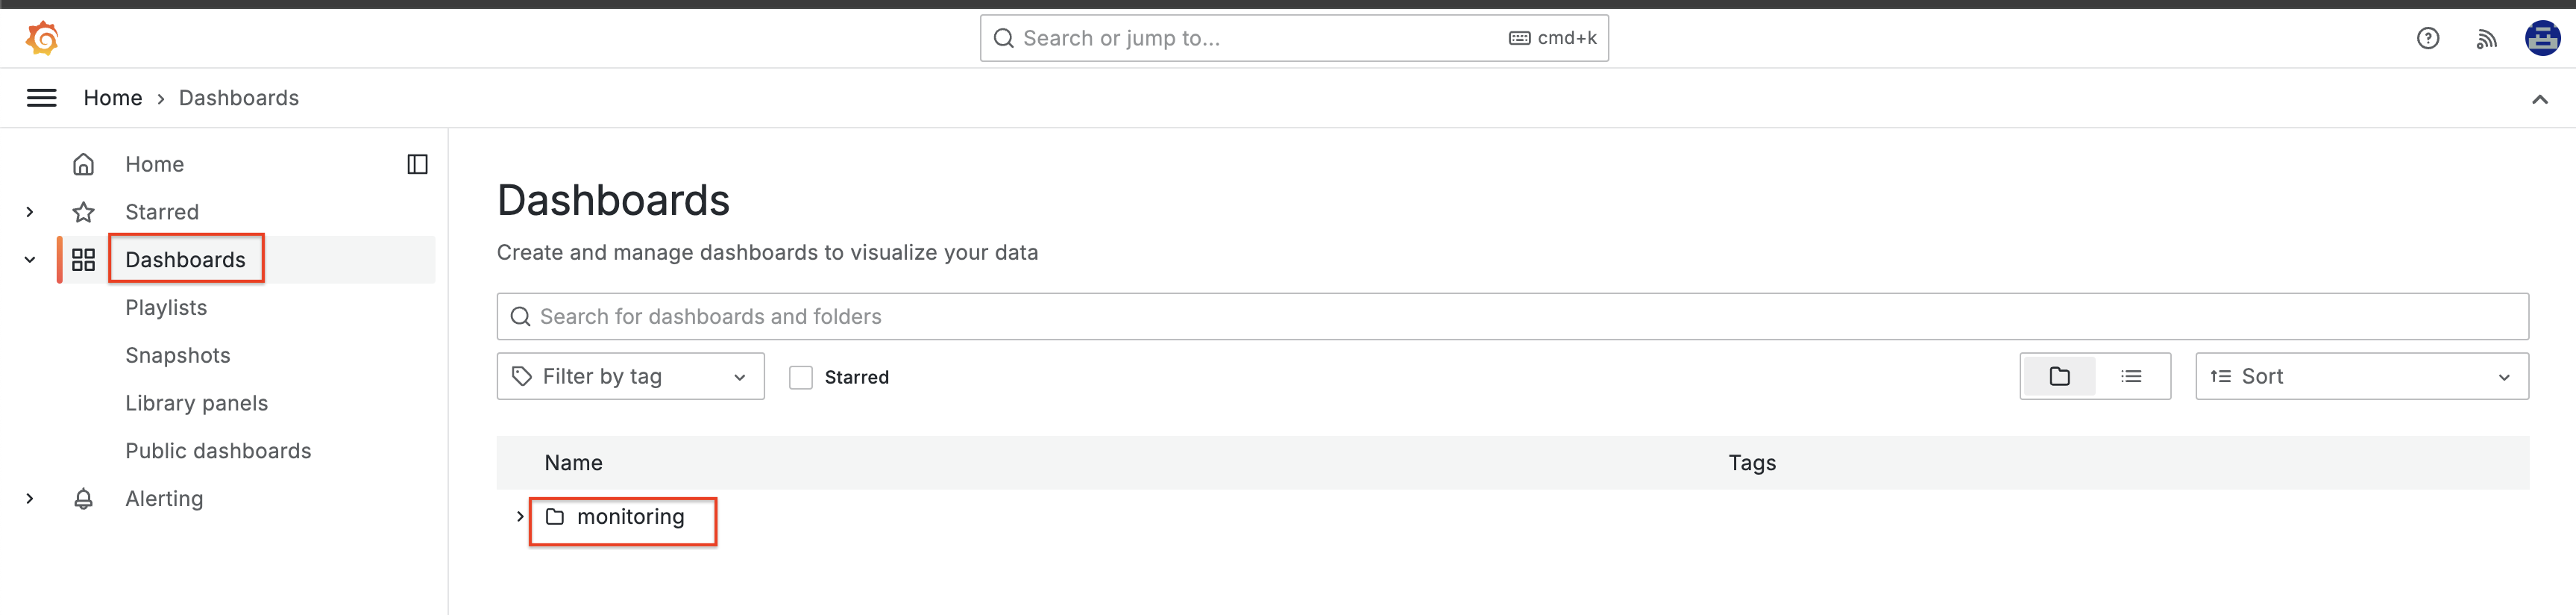
From the left-hand navigation, access the Dashboards menu.
-
Click on the monitoring folder to view the preloaded dashboards.
Click to view the image in full screen.
Explore persona-based Dashboards
-
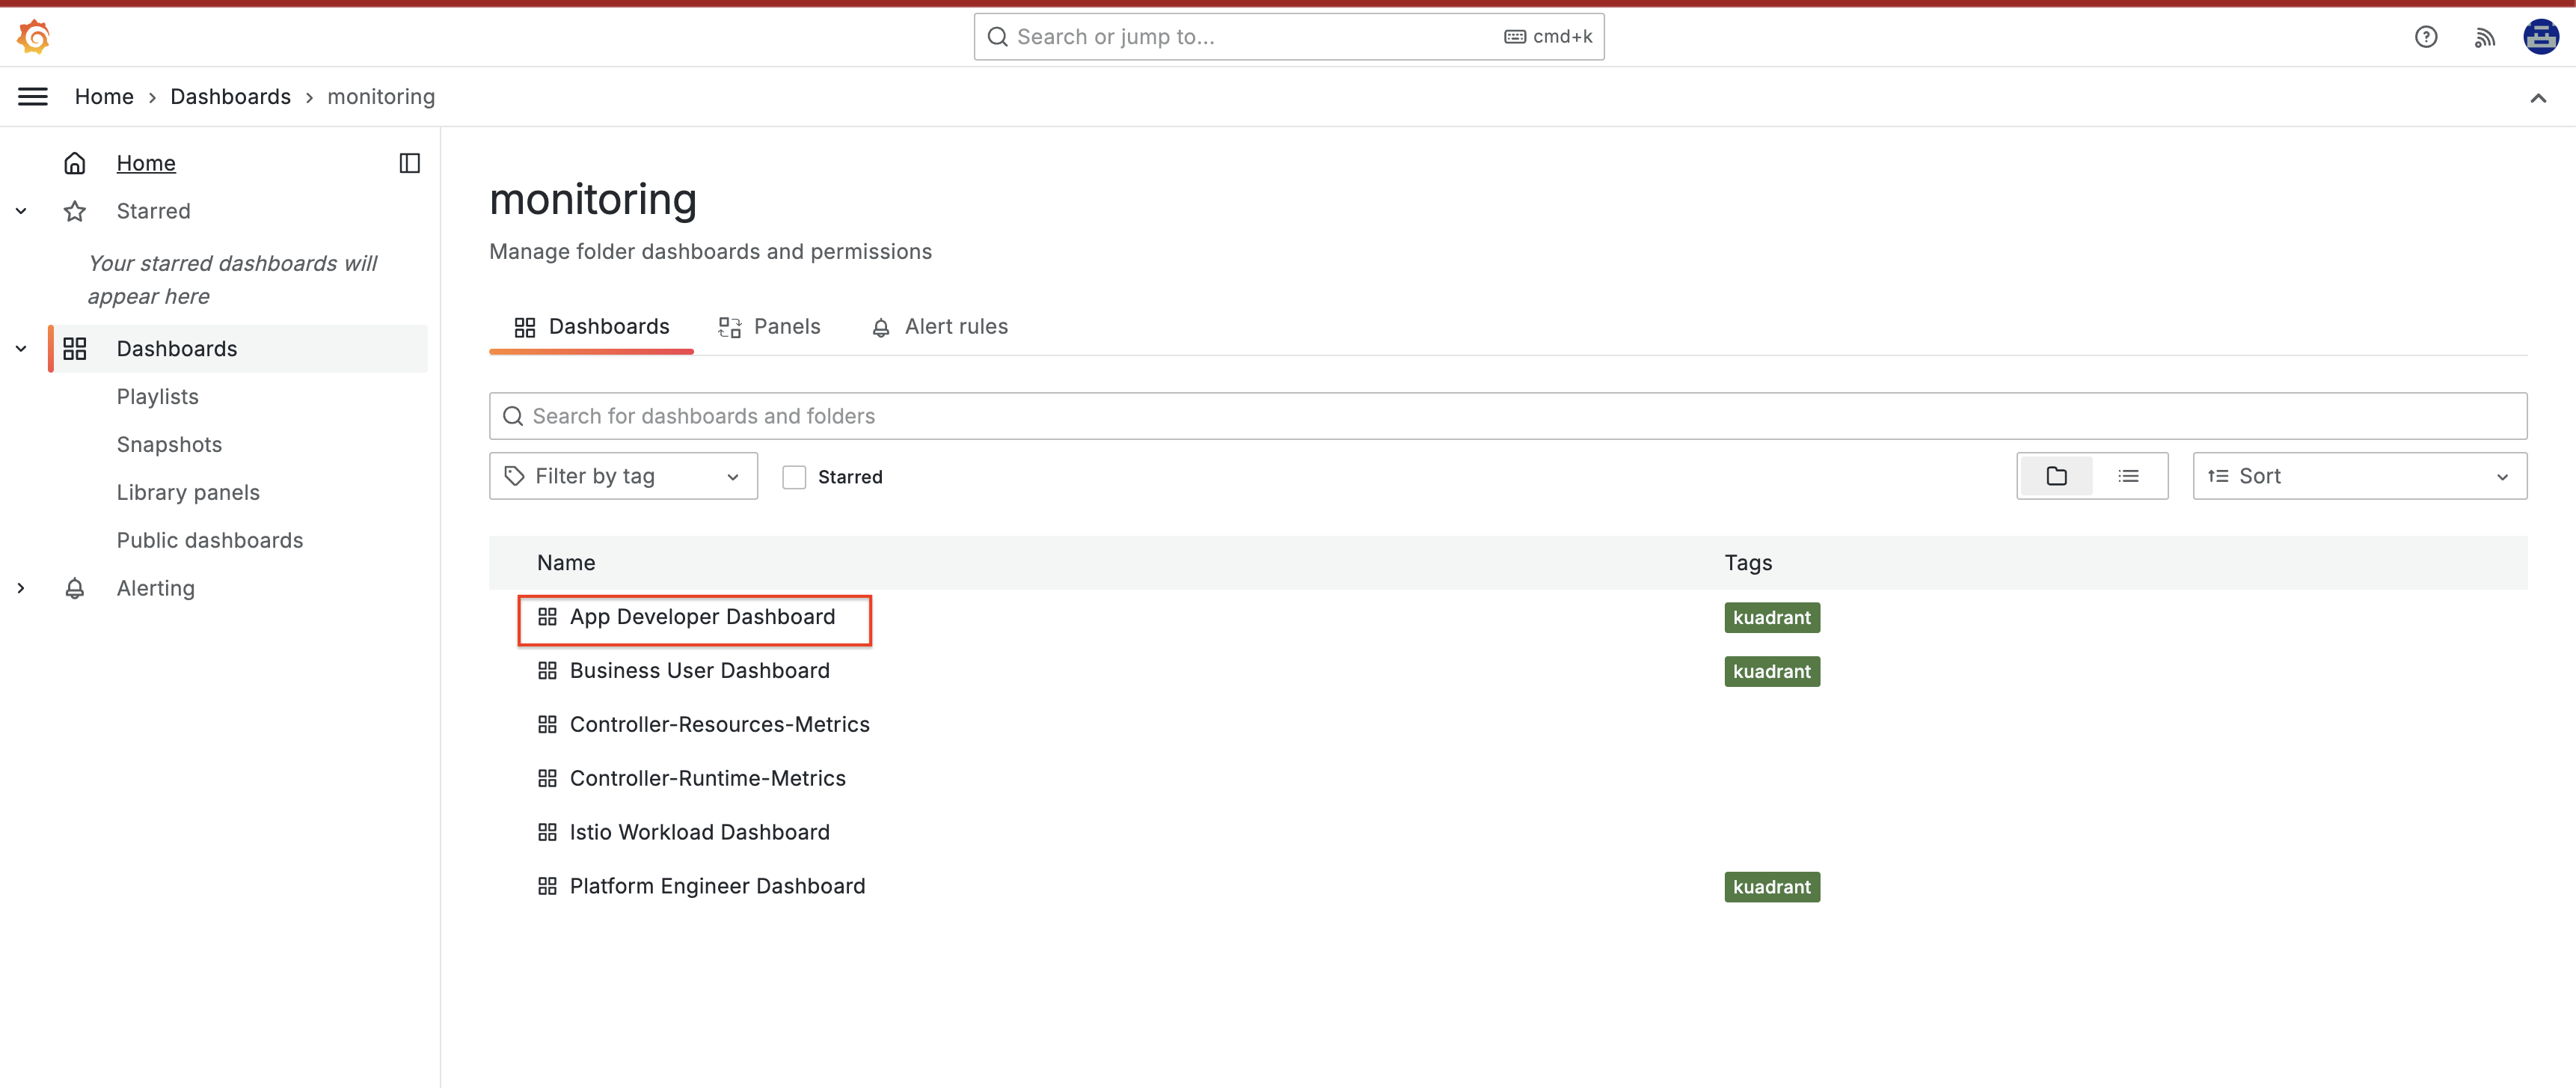
Click on the App Developer Dashboard link to view the data. You will be presented with the metrics for both
echo-apiandtravel-agencyAPIs.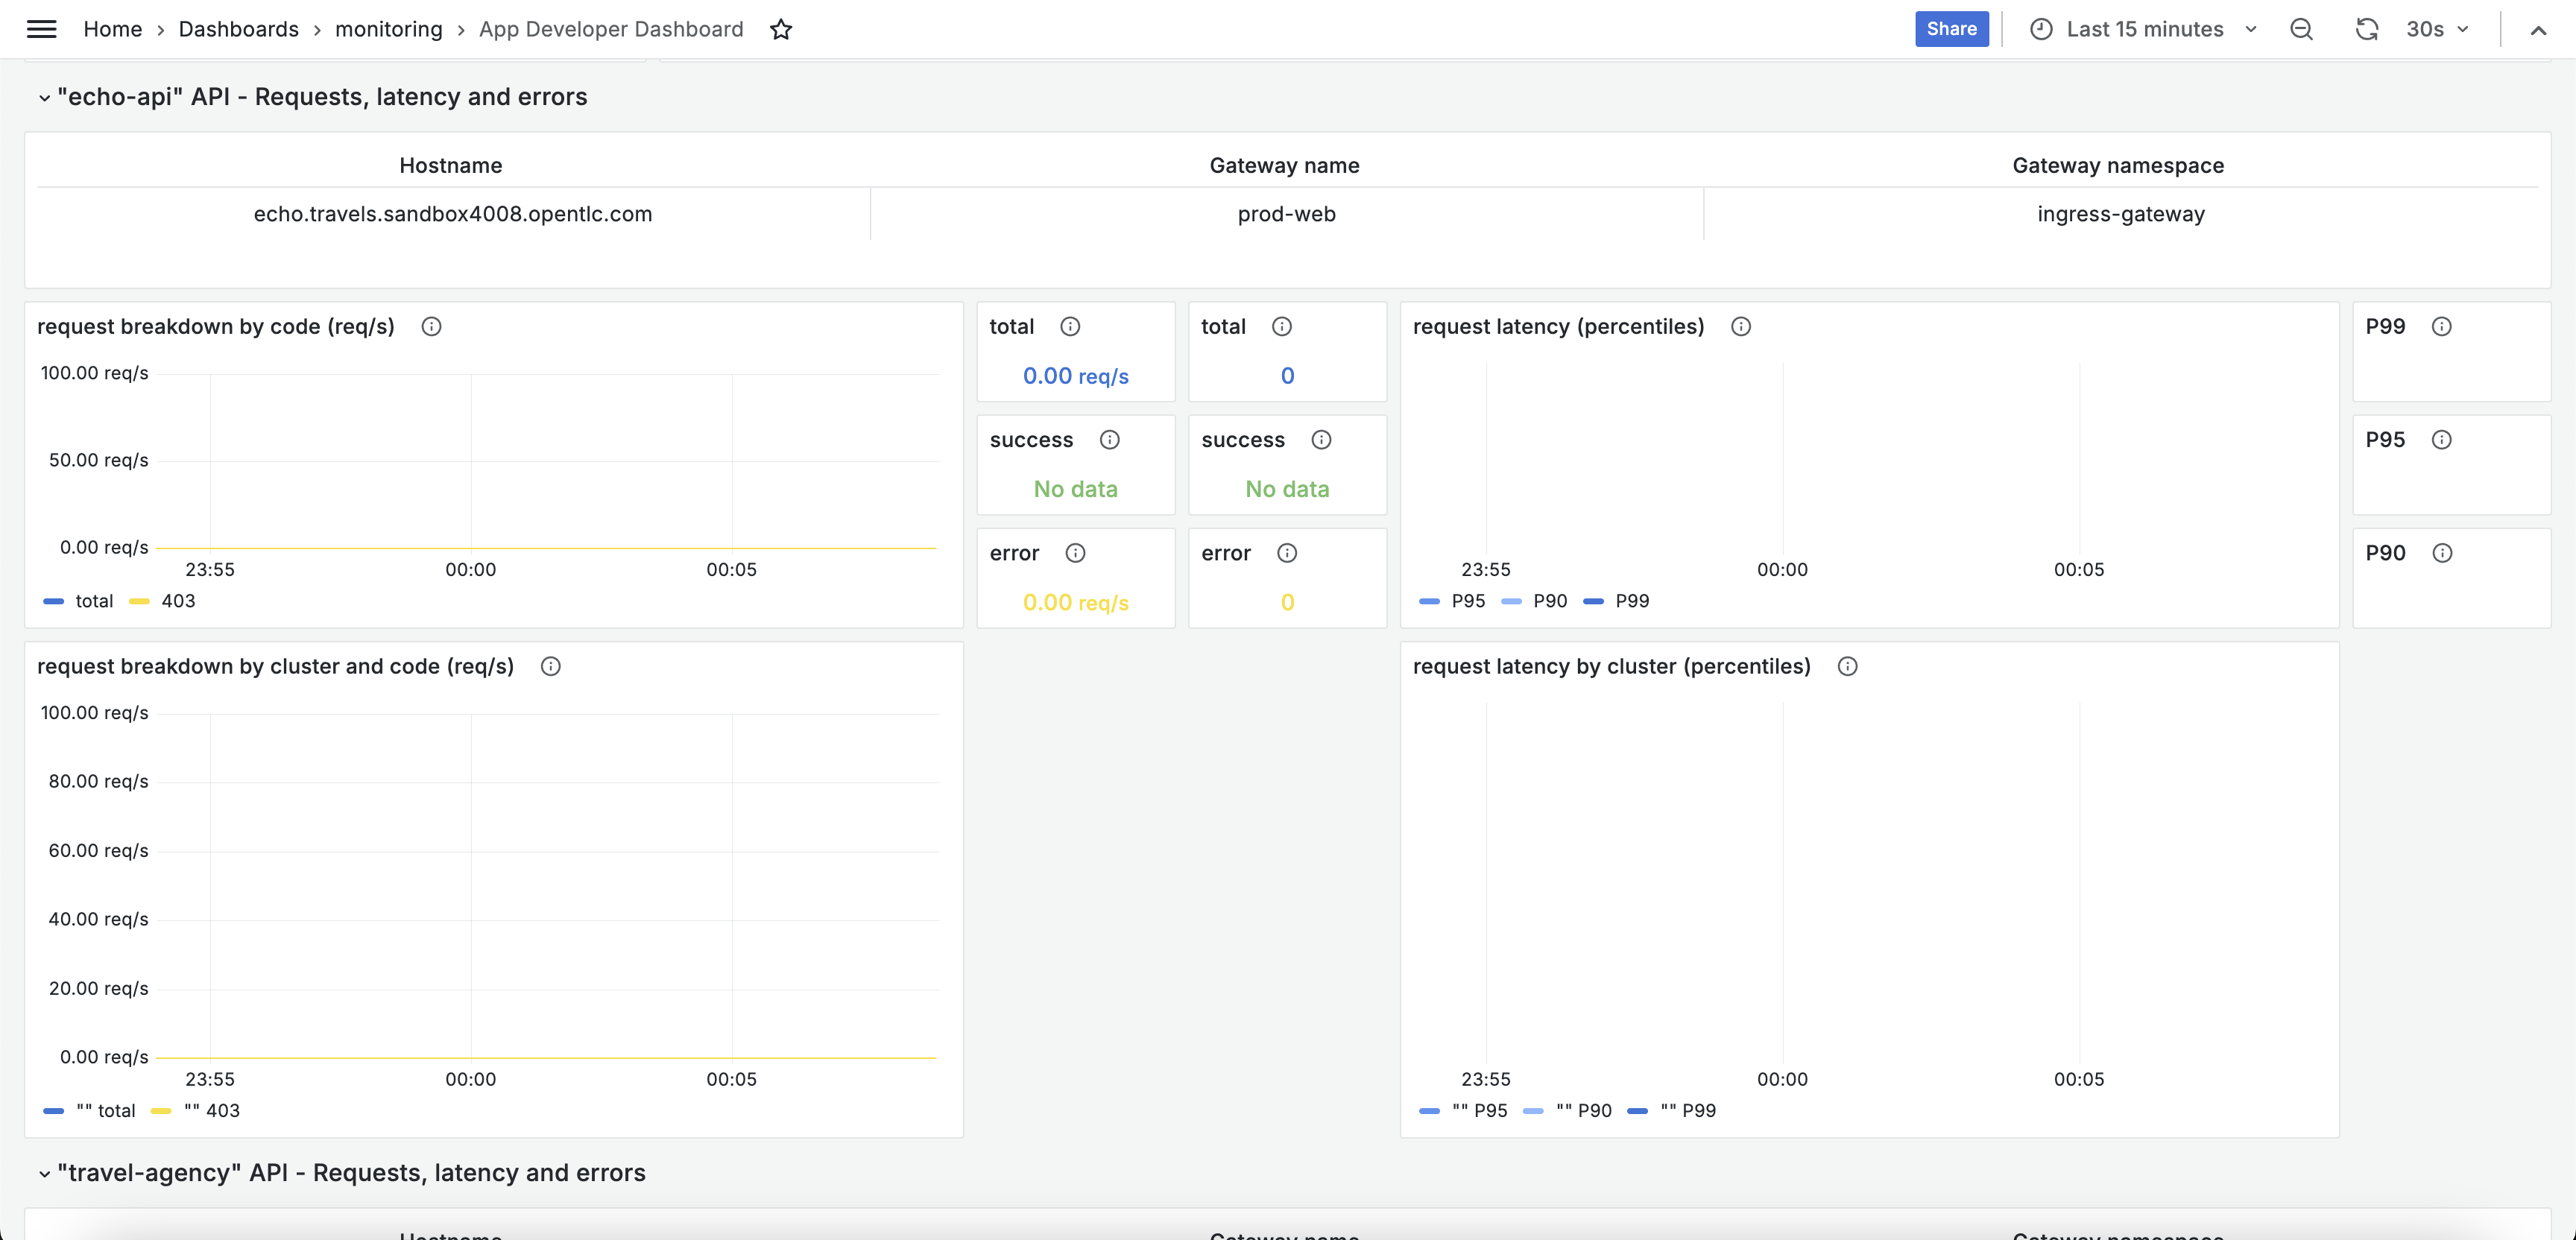
-
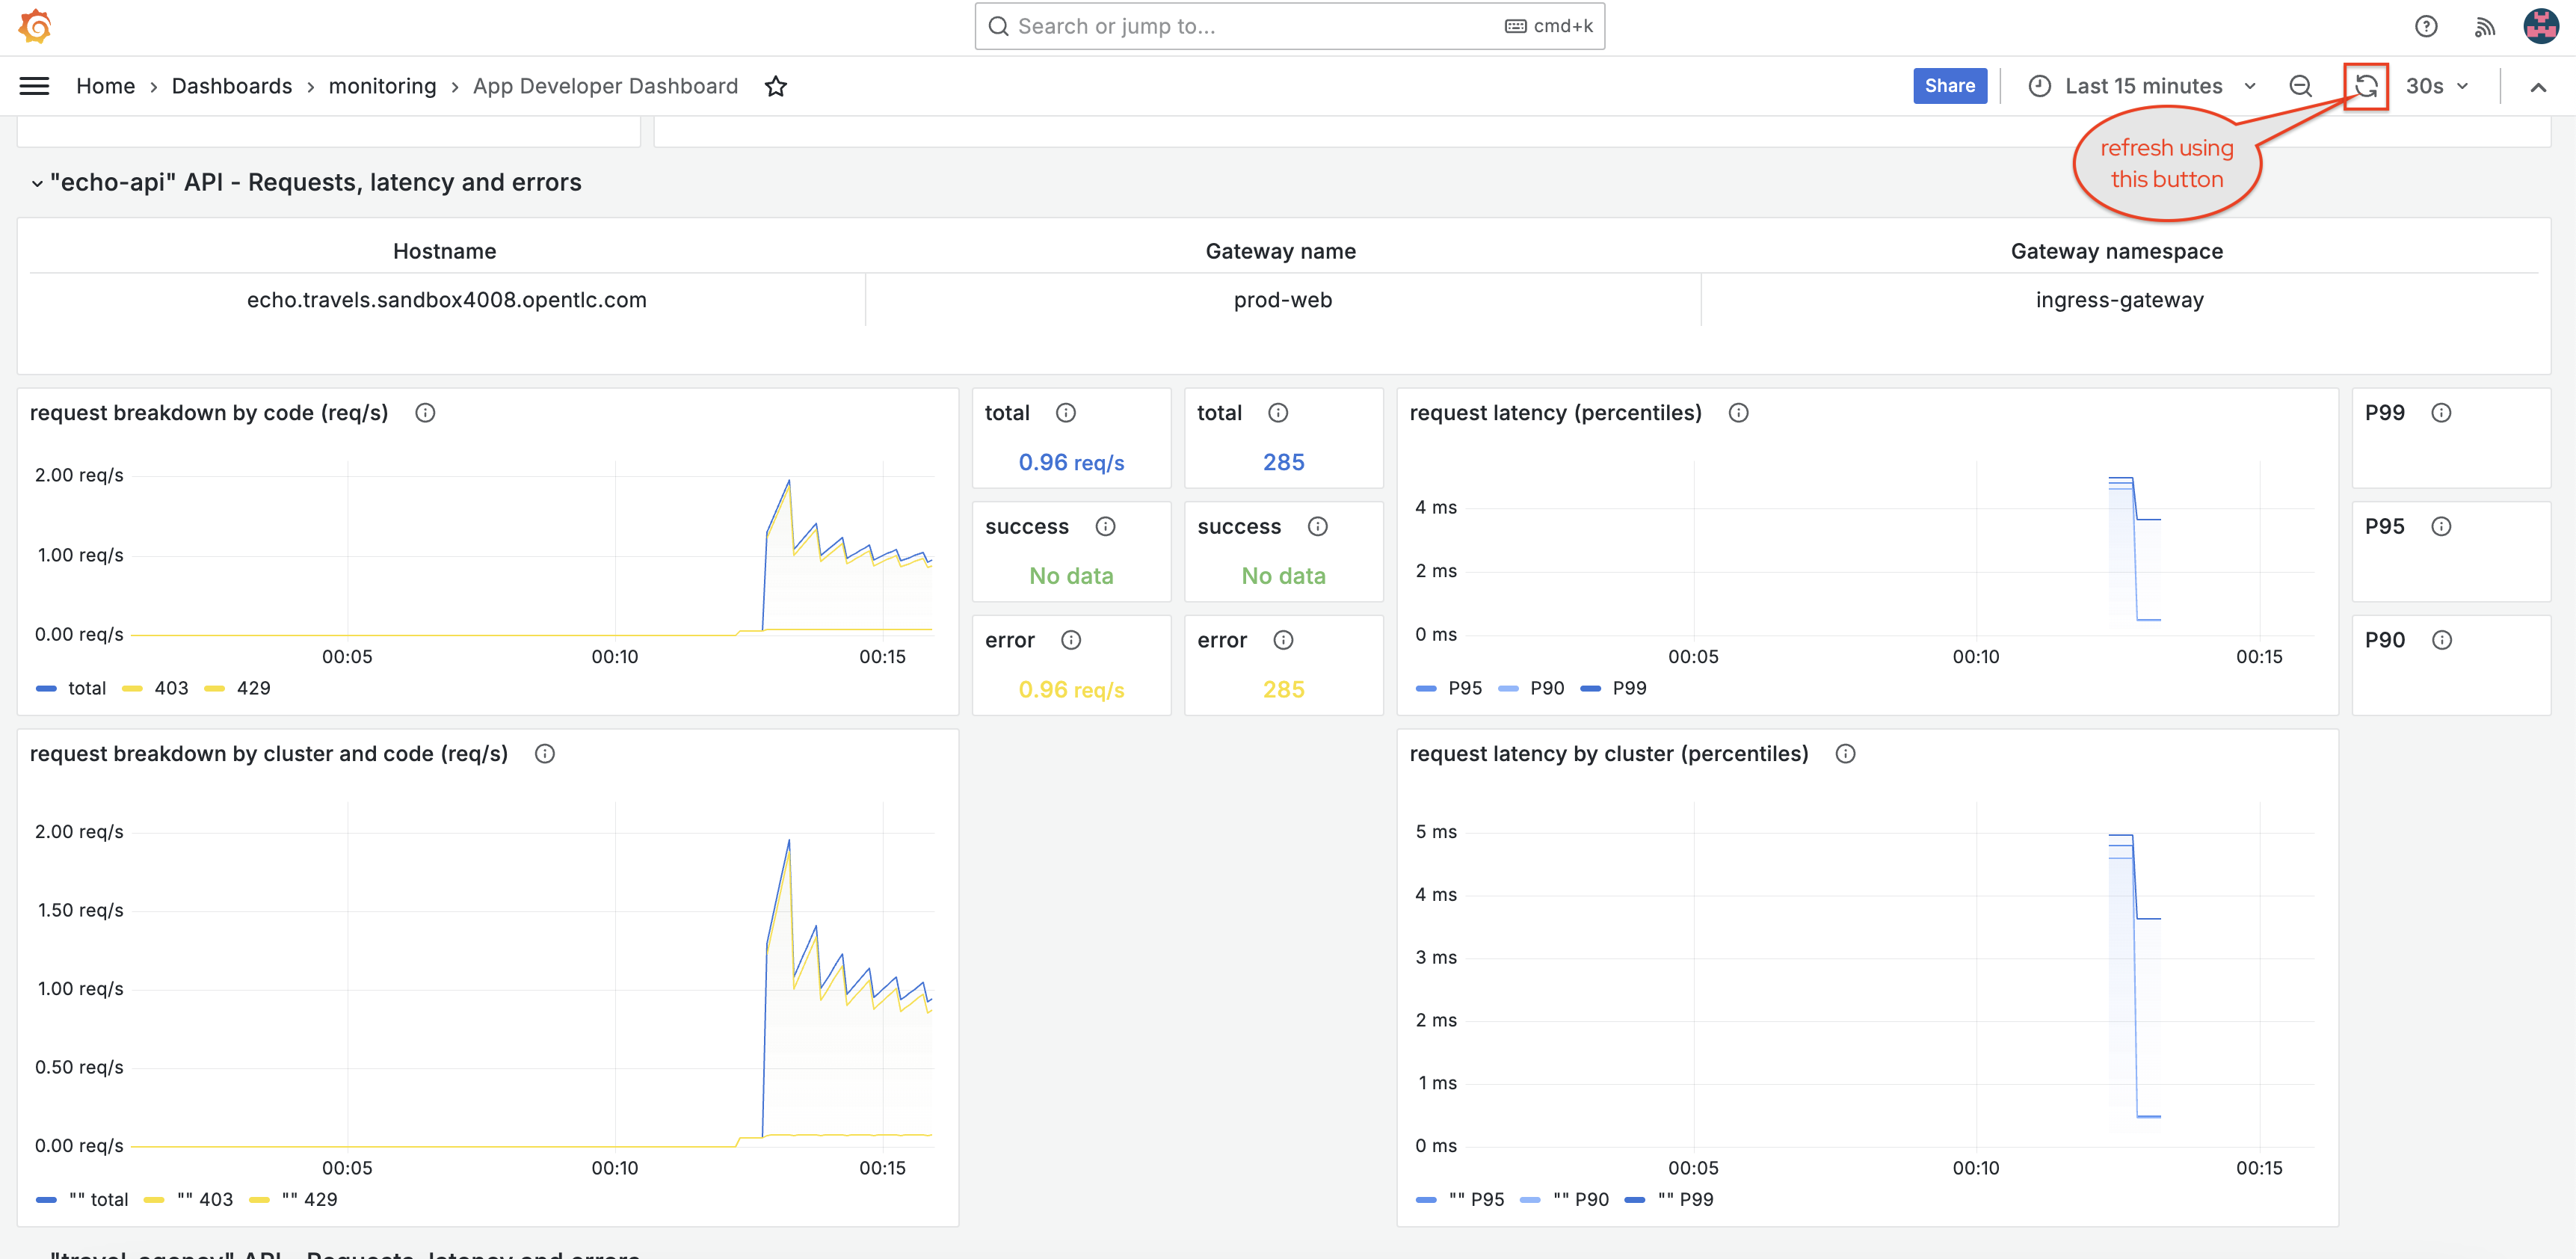
For the sake of this workshop, let us create some traffic to the
echo-api. Run the following command on the upper terminal. You will see a combination of 403 and 429 errors in the terminal.for i in {1..1000}; do curl -k -w "%{http_code}" https://echo.travels.{ocp_cluster_workshop_main_domain}; done -
Access the Grafana dashboard tab again, and click the refresh button as shown in the screenshot below.
You may need to refresh a couple of times for the metrics to appear in the Grafana dashboard.
Notice that 429 and 403 requests, as well as the total requests, are available in the different sections of the dashboard.
-
Next, click the Platform Engineer Dashboard link on the top left of the page.
-
View Gateway, HTTPRoute, and its policies
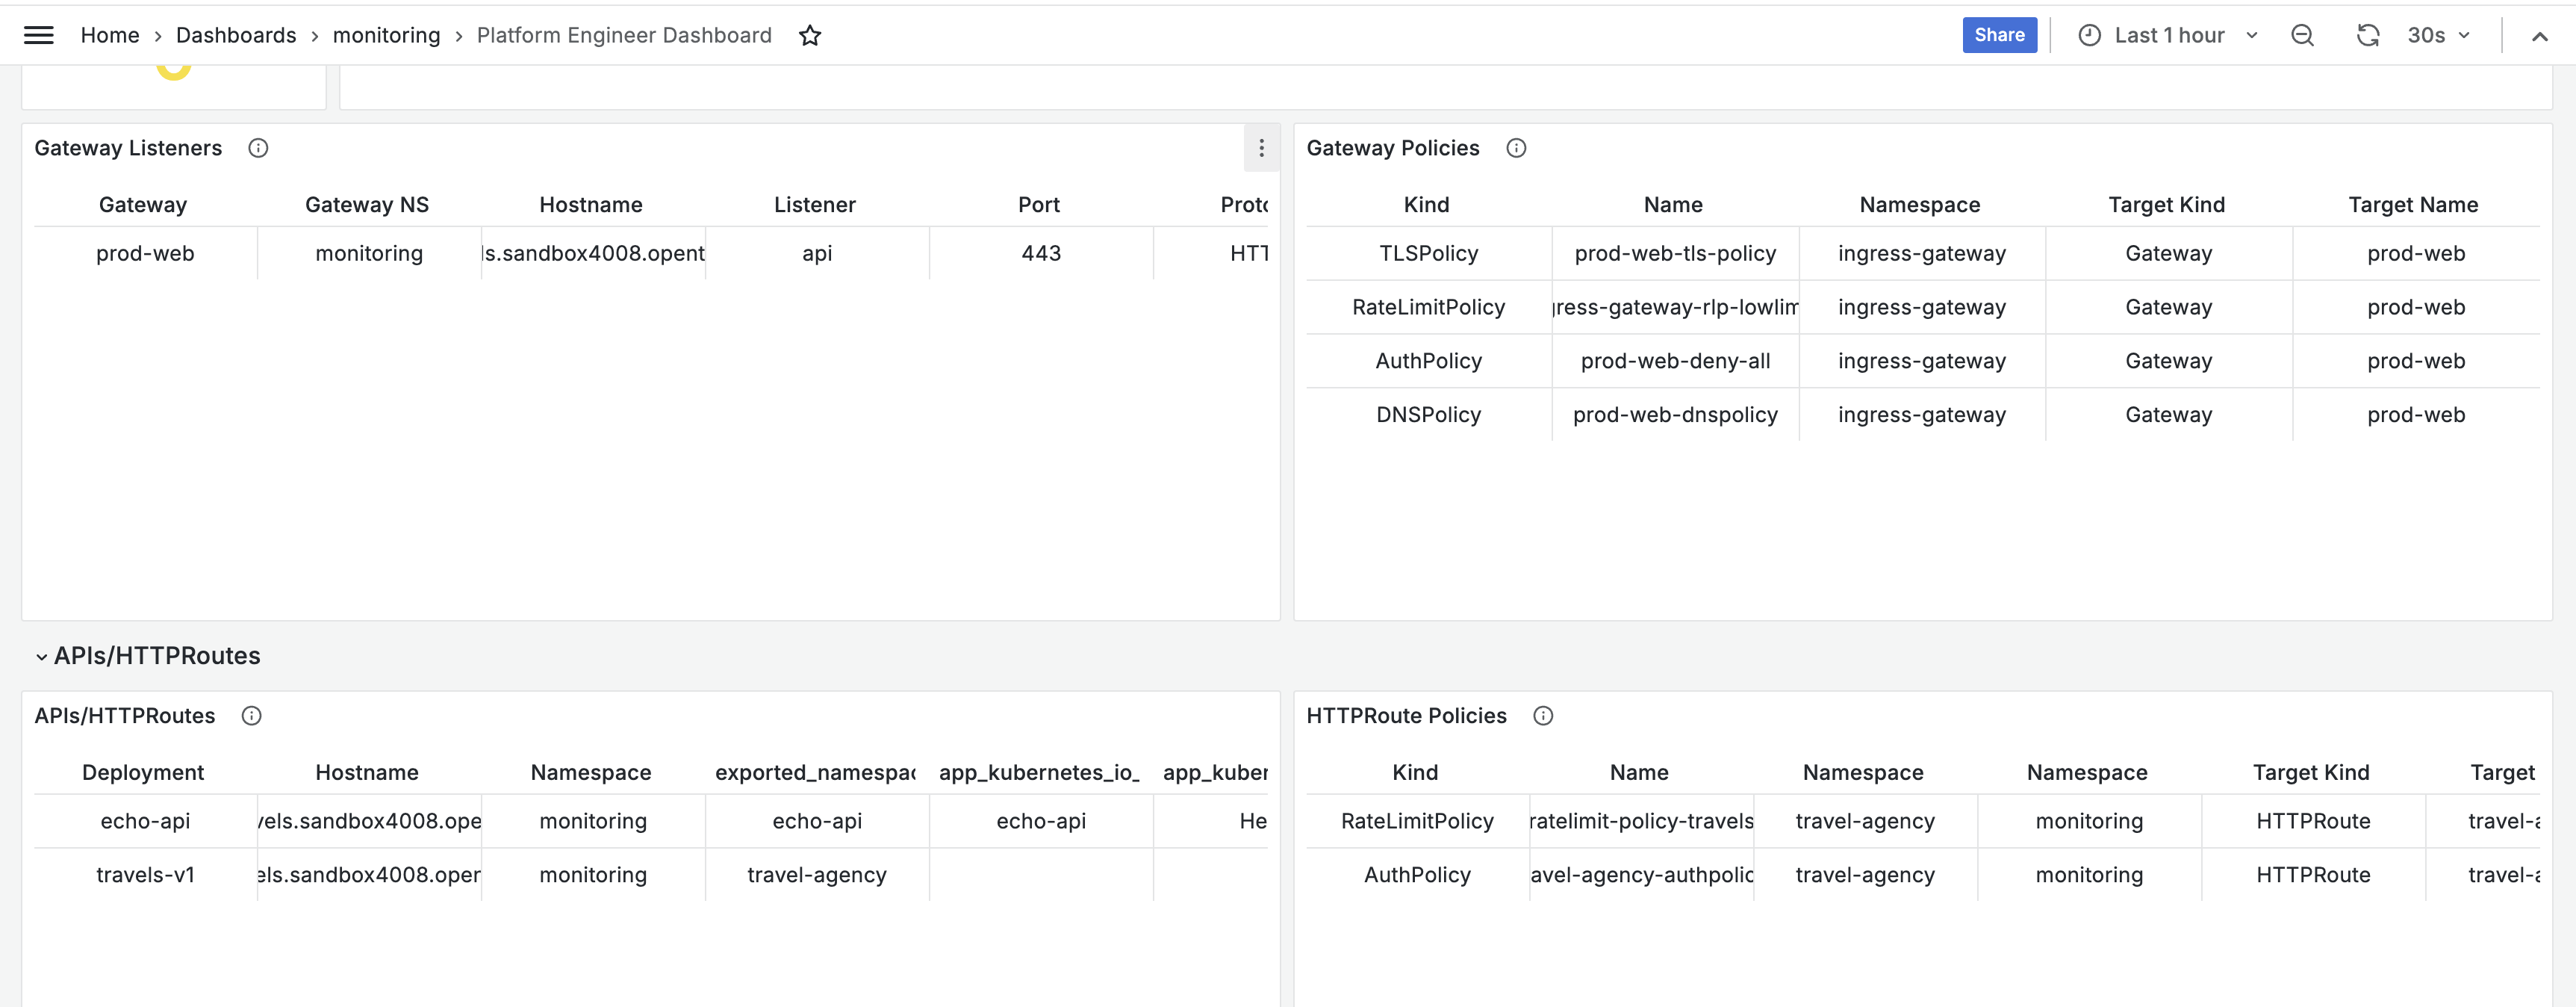
Don’t see the HTTPRoute’s policies? You might need to restart the kube-state-metrics pod.
-
Run this command in the top-right terminal to nudge the metrics a bit.
oc rollout restart deployment/kube-state-metrics-kuadrant -n monitoring -
Refresh the dashboard using the
 button on top-right of the browser, and voila, everything is alright in our dashboard world.
-
-
View details of Total requests, latency, and CPU and memory usage
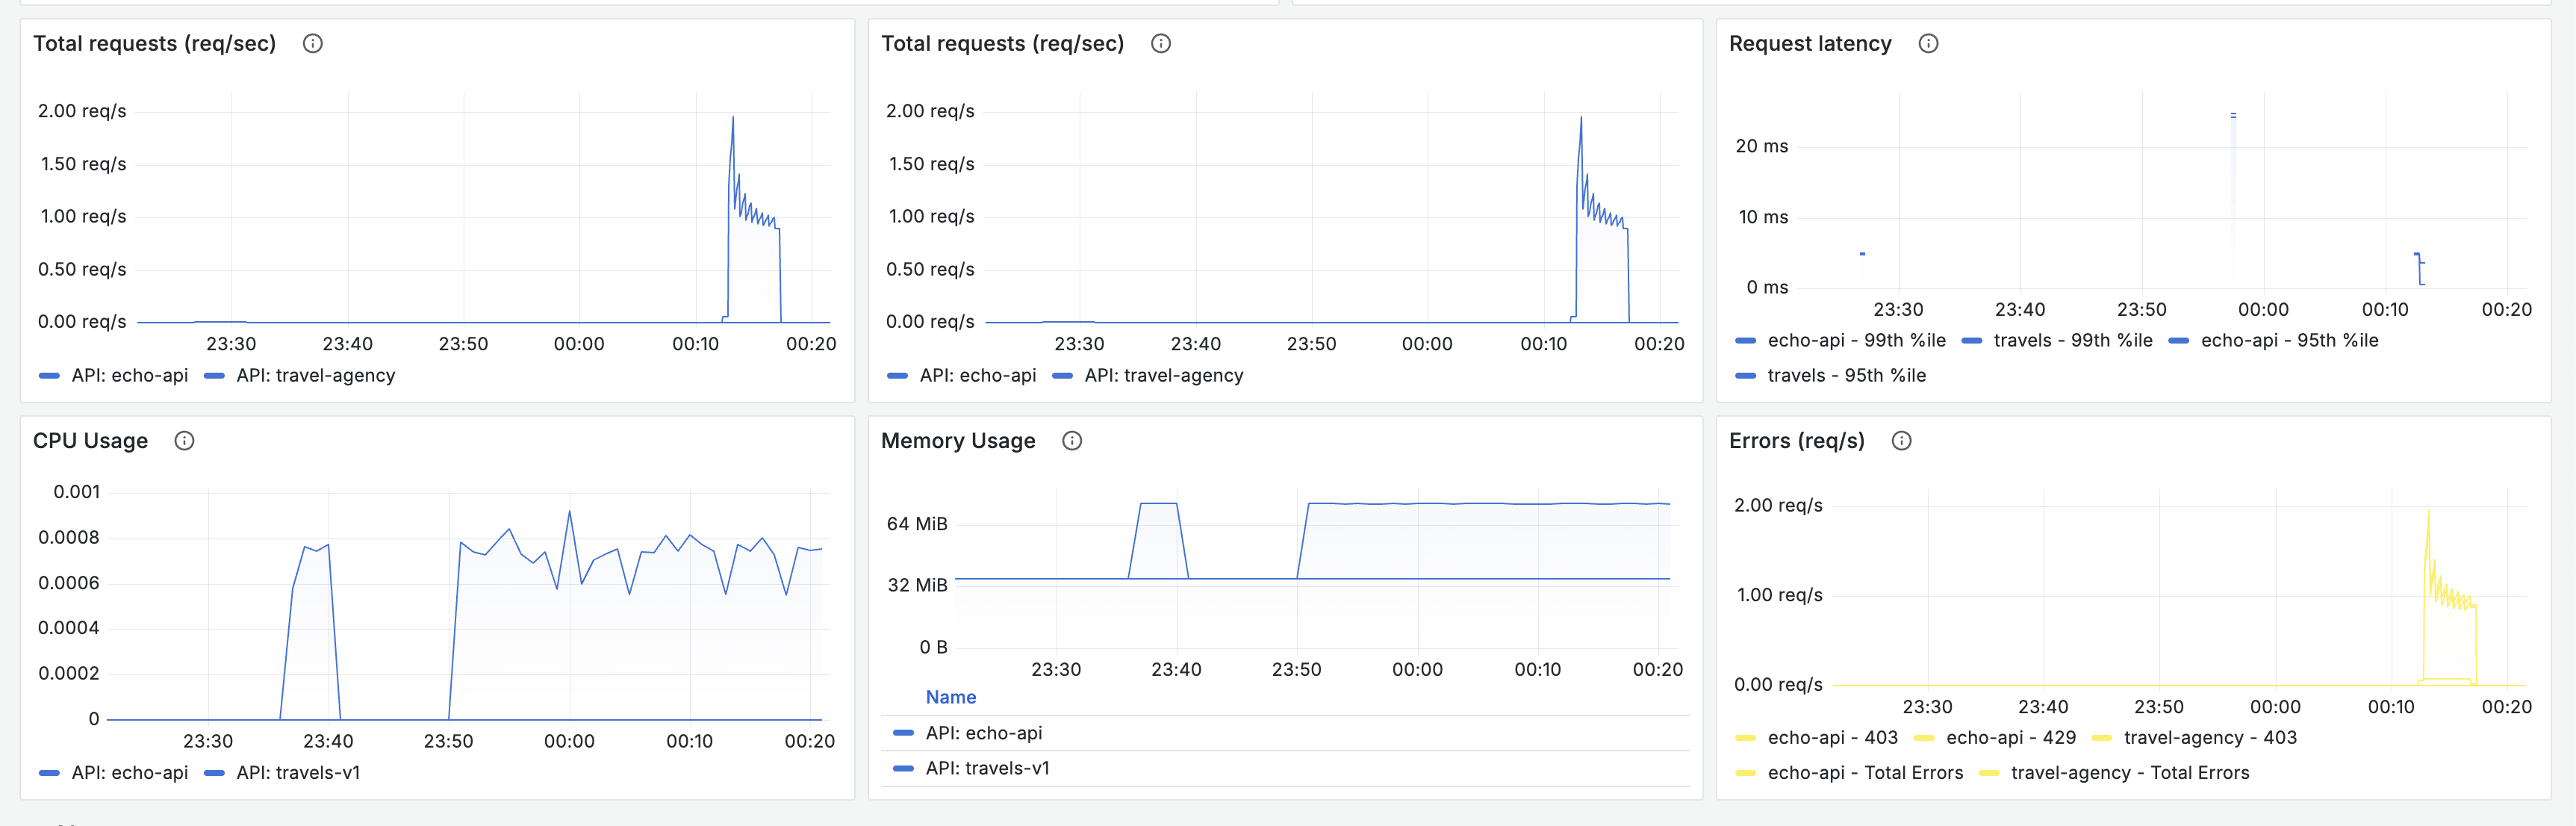
-
-
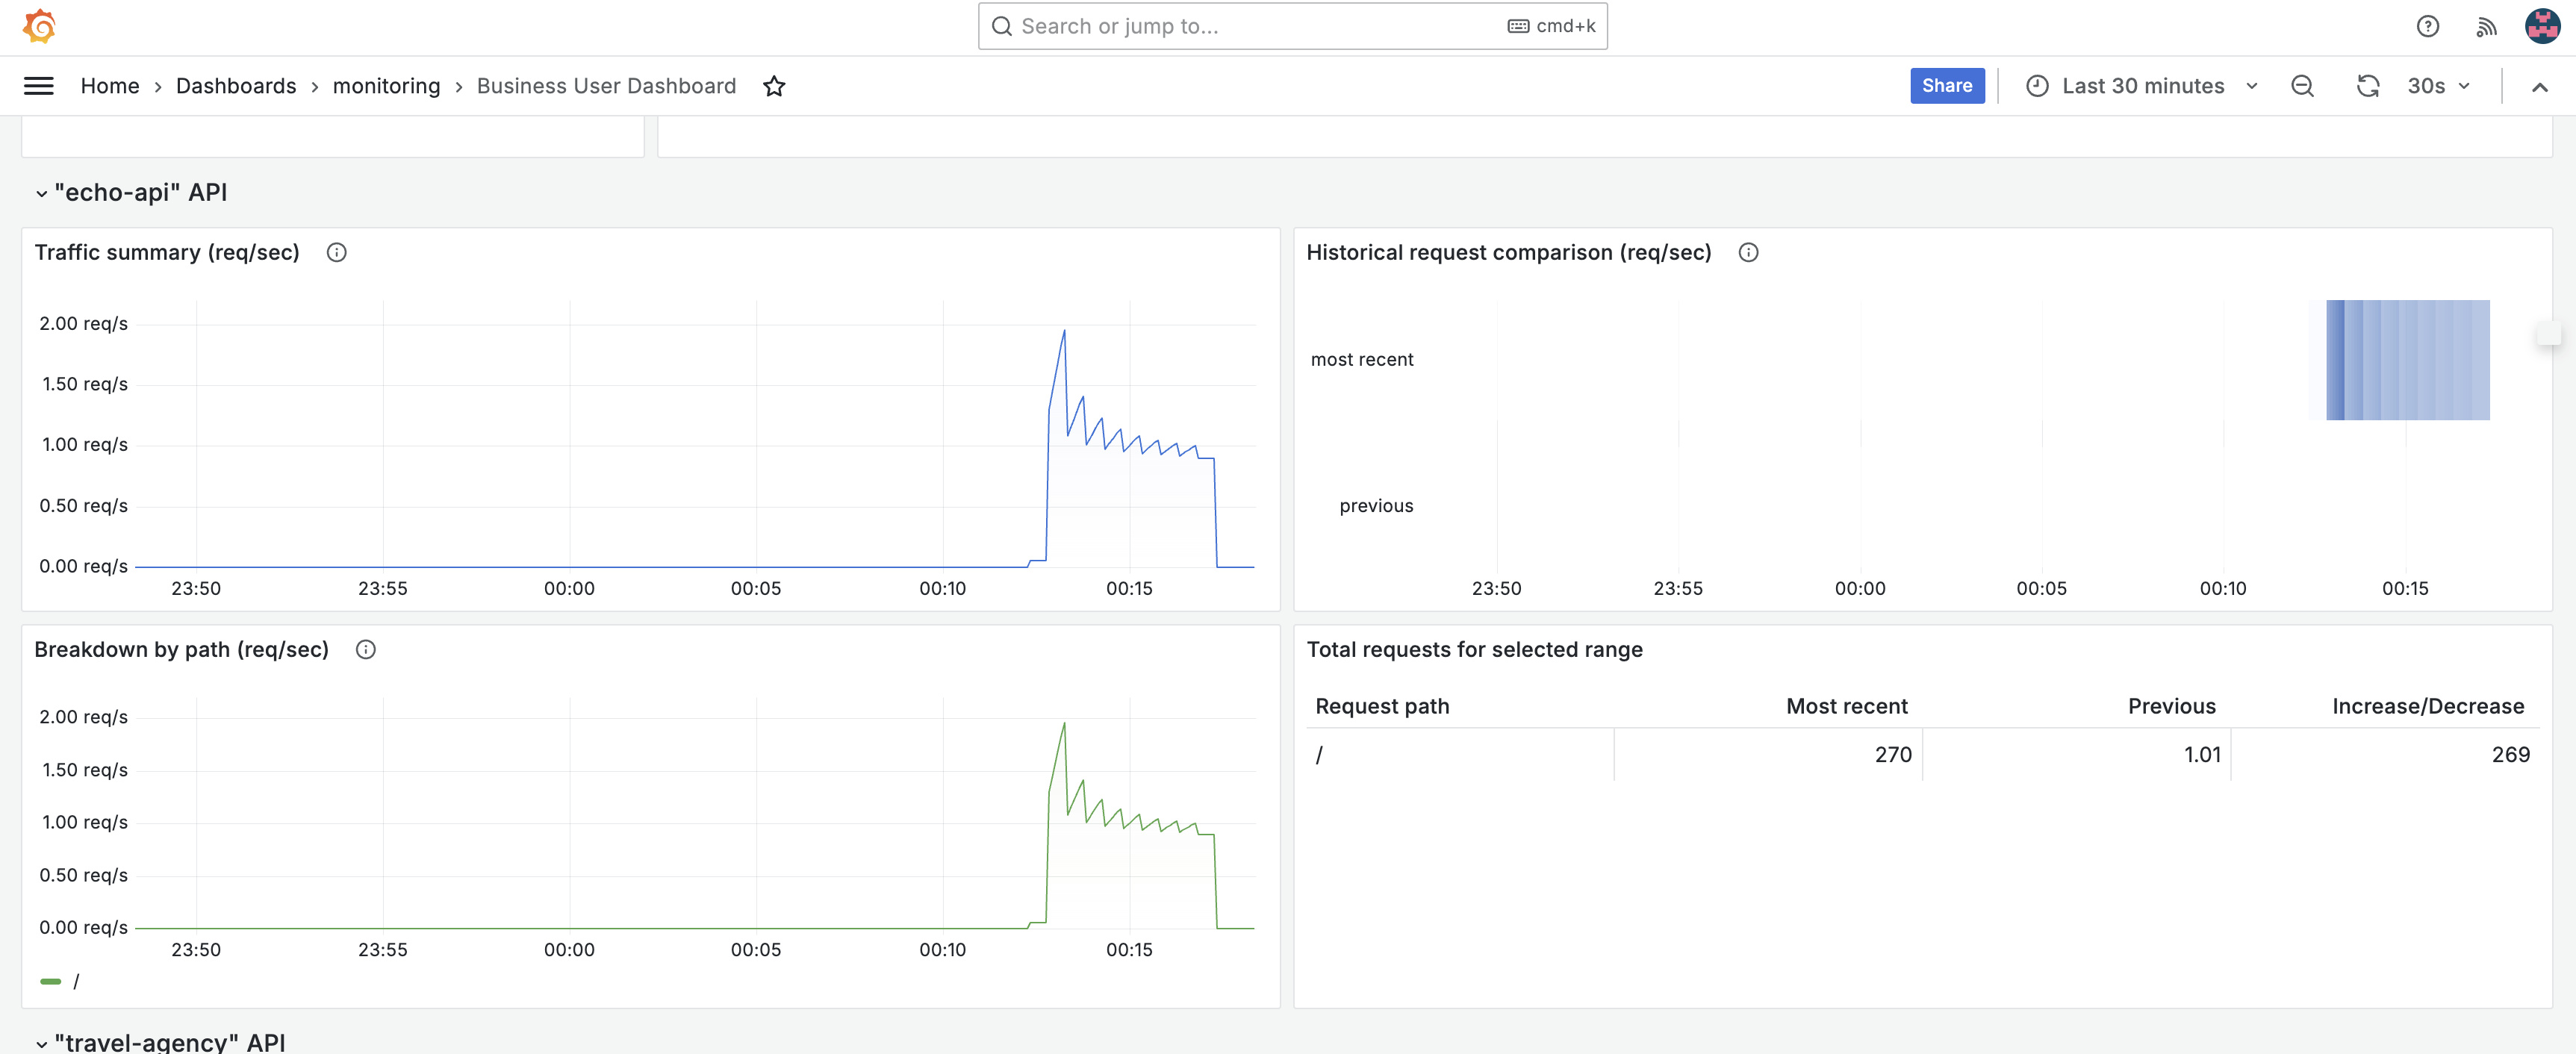
Finally, click the Business User Dashboard link at the top left of the page. This dashboard shows data such as traffic summary and historical request comparison, which are more relevant to business users.