Activity: Explore Service Mesh with Kiali
Module 2
Kiali offers a number of ways to examine the microservices which are managed by Red Hat OpenShift Service Mesh. This helps users to quickly evaluate the health of their service architecture.
In this module we will explore just a few ways to explore the real-time metrics.
Explore Traffic Graph
-
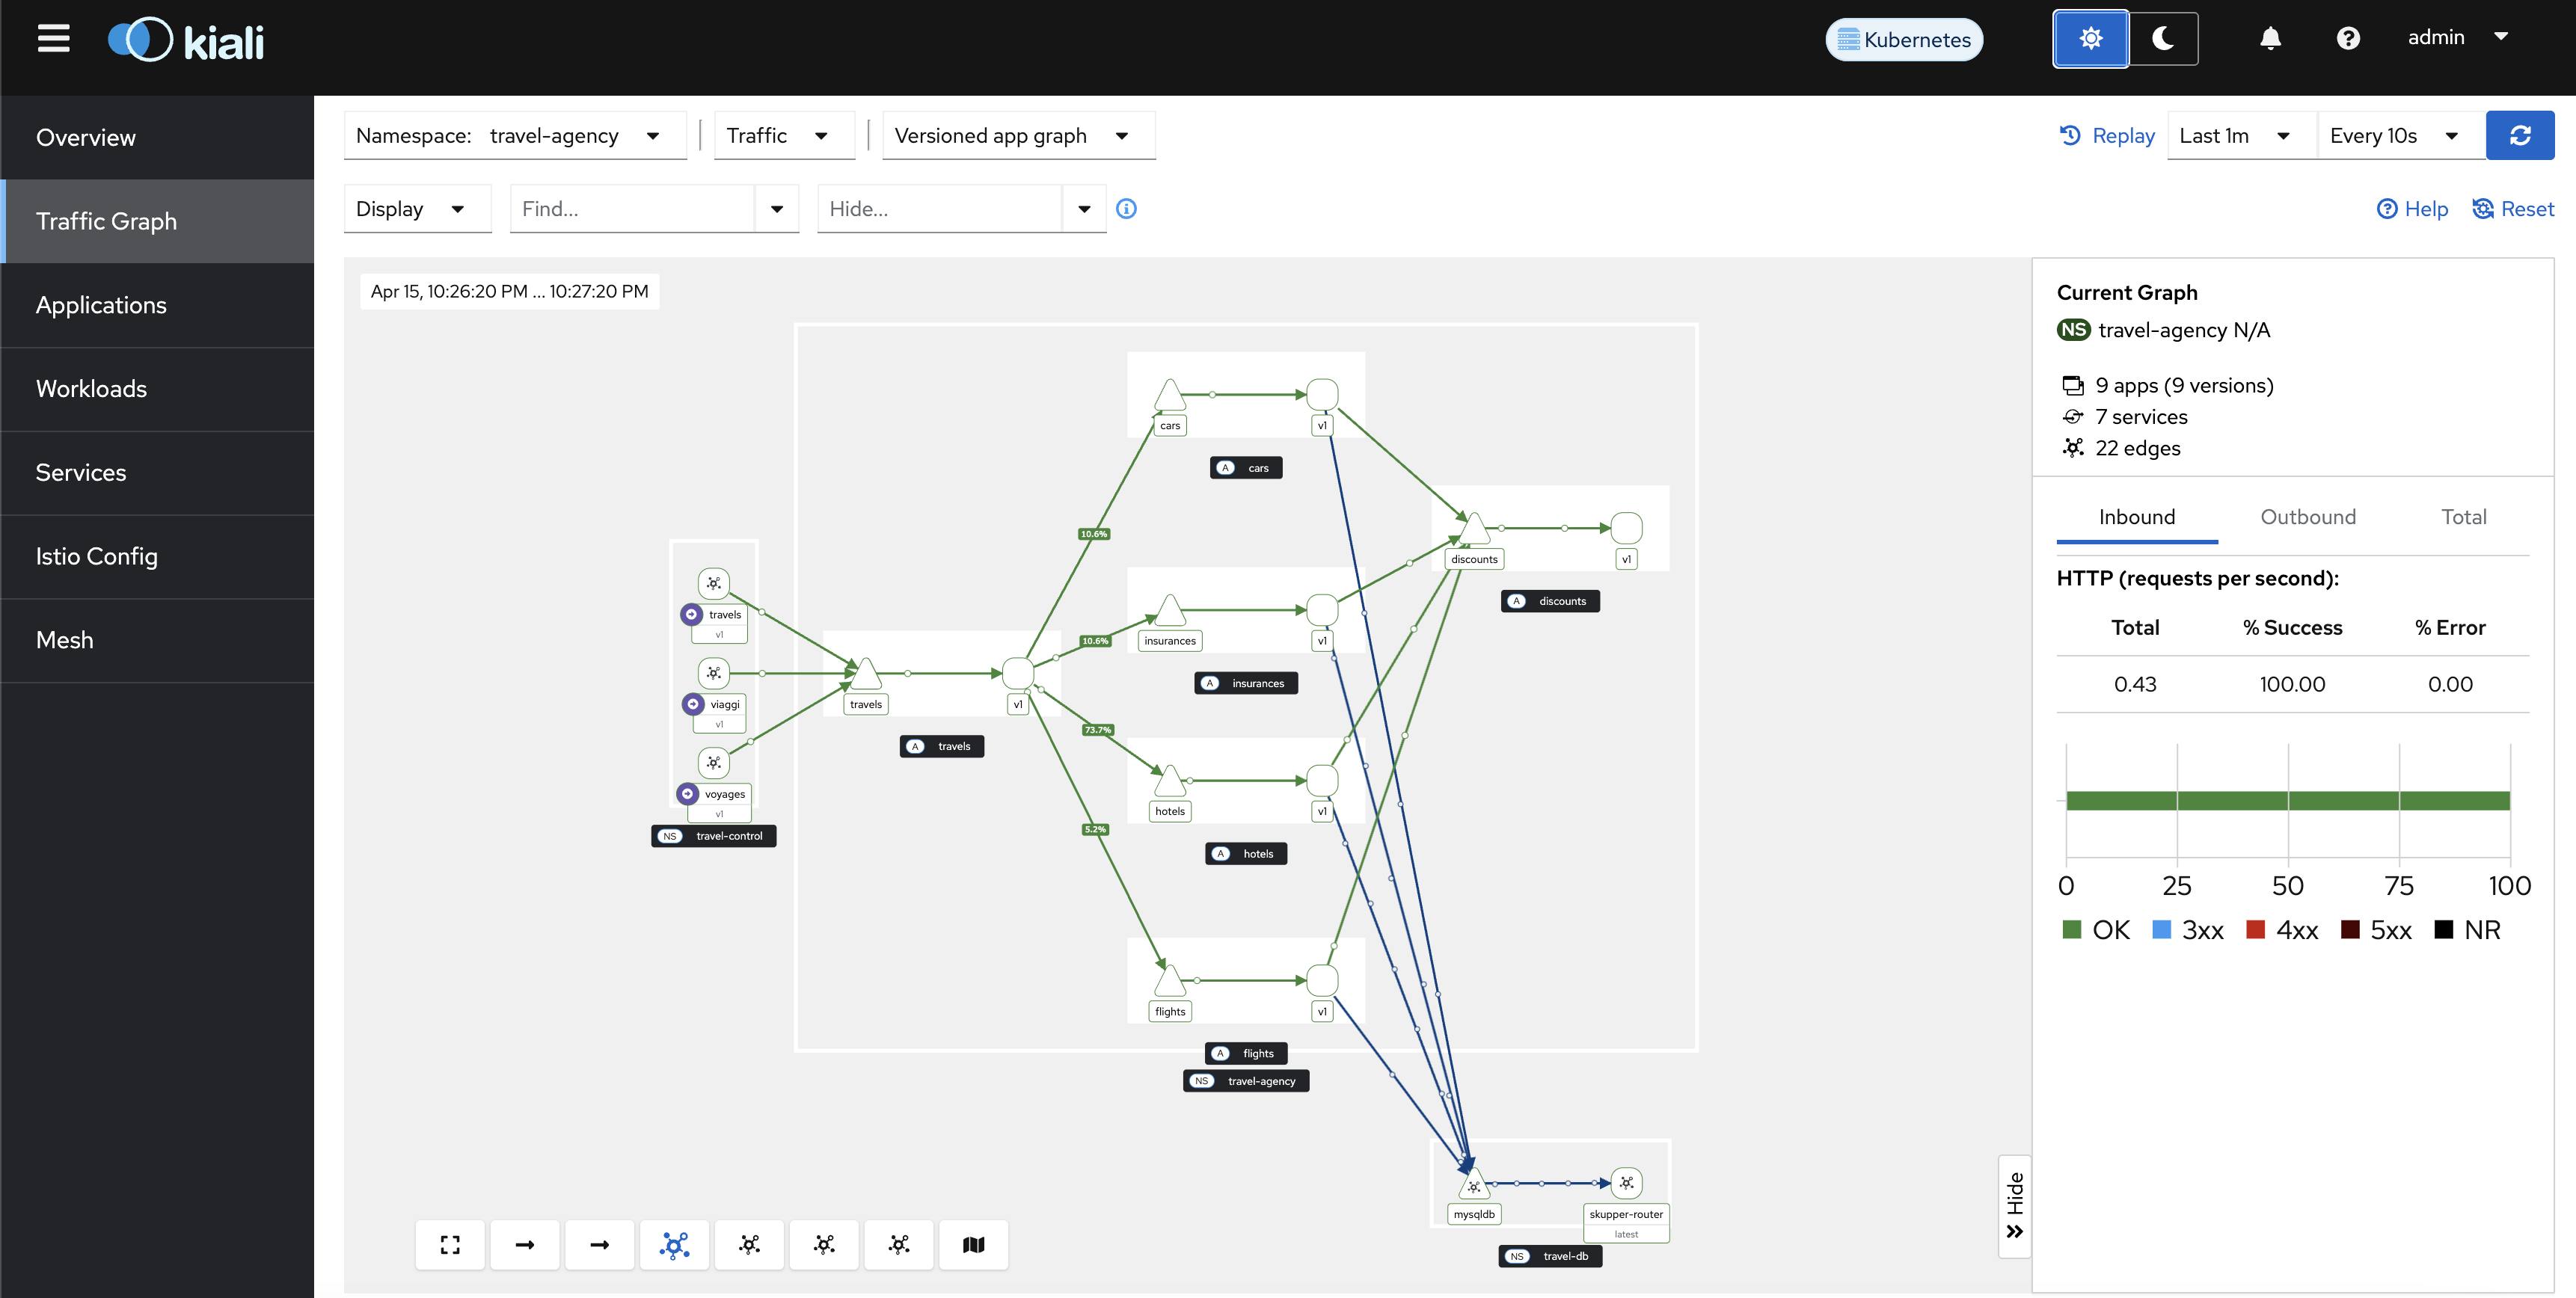
Click Kiali’s Traffic Graph to view the details of the
travel-agencynamespace.Some parameters have been preset in this link for easier access. Refresh rate is set at
10s, and Traffic Distribution and Traffic Animation (for a dynamic view) options have been turned ON. -
The Traffic Graph shows service interactions, request rates, and HTTP status codes. This graph helps us identify services that may have problems. In our example, everything is green and healthy!
Click to view the image in full screen.
Since sidecar injection was enabled just a while ago, it may take a minute or two for the graph to show the updated metrics. -
You can zoom into the Kiali console to get a better view of the
travel-agencyTraffic Graph.Wondering where all this traffic is coming from? As part of the workshop set up, a traffic simulator has also been deployed on OpenShift (。◕‿◕。)
Explore Workloads
-
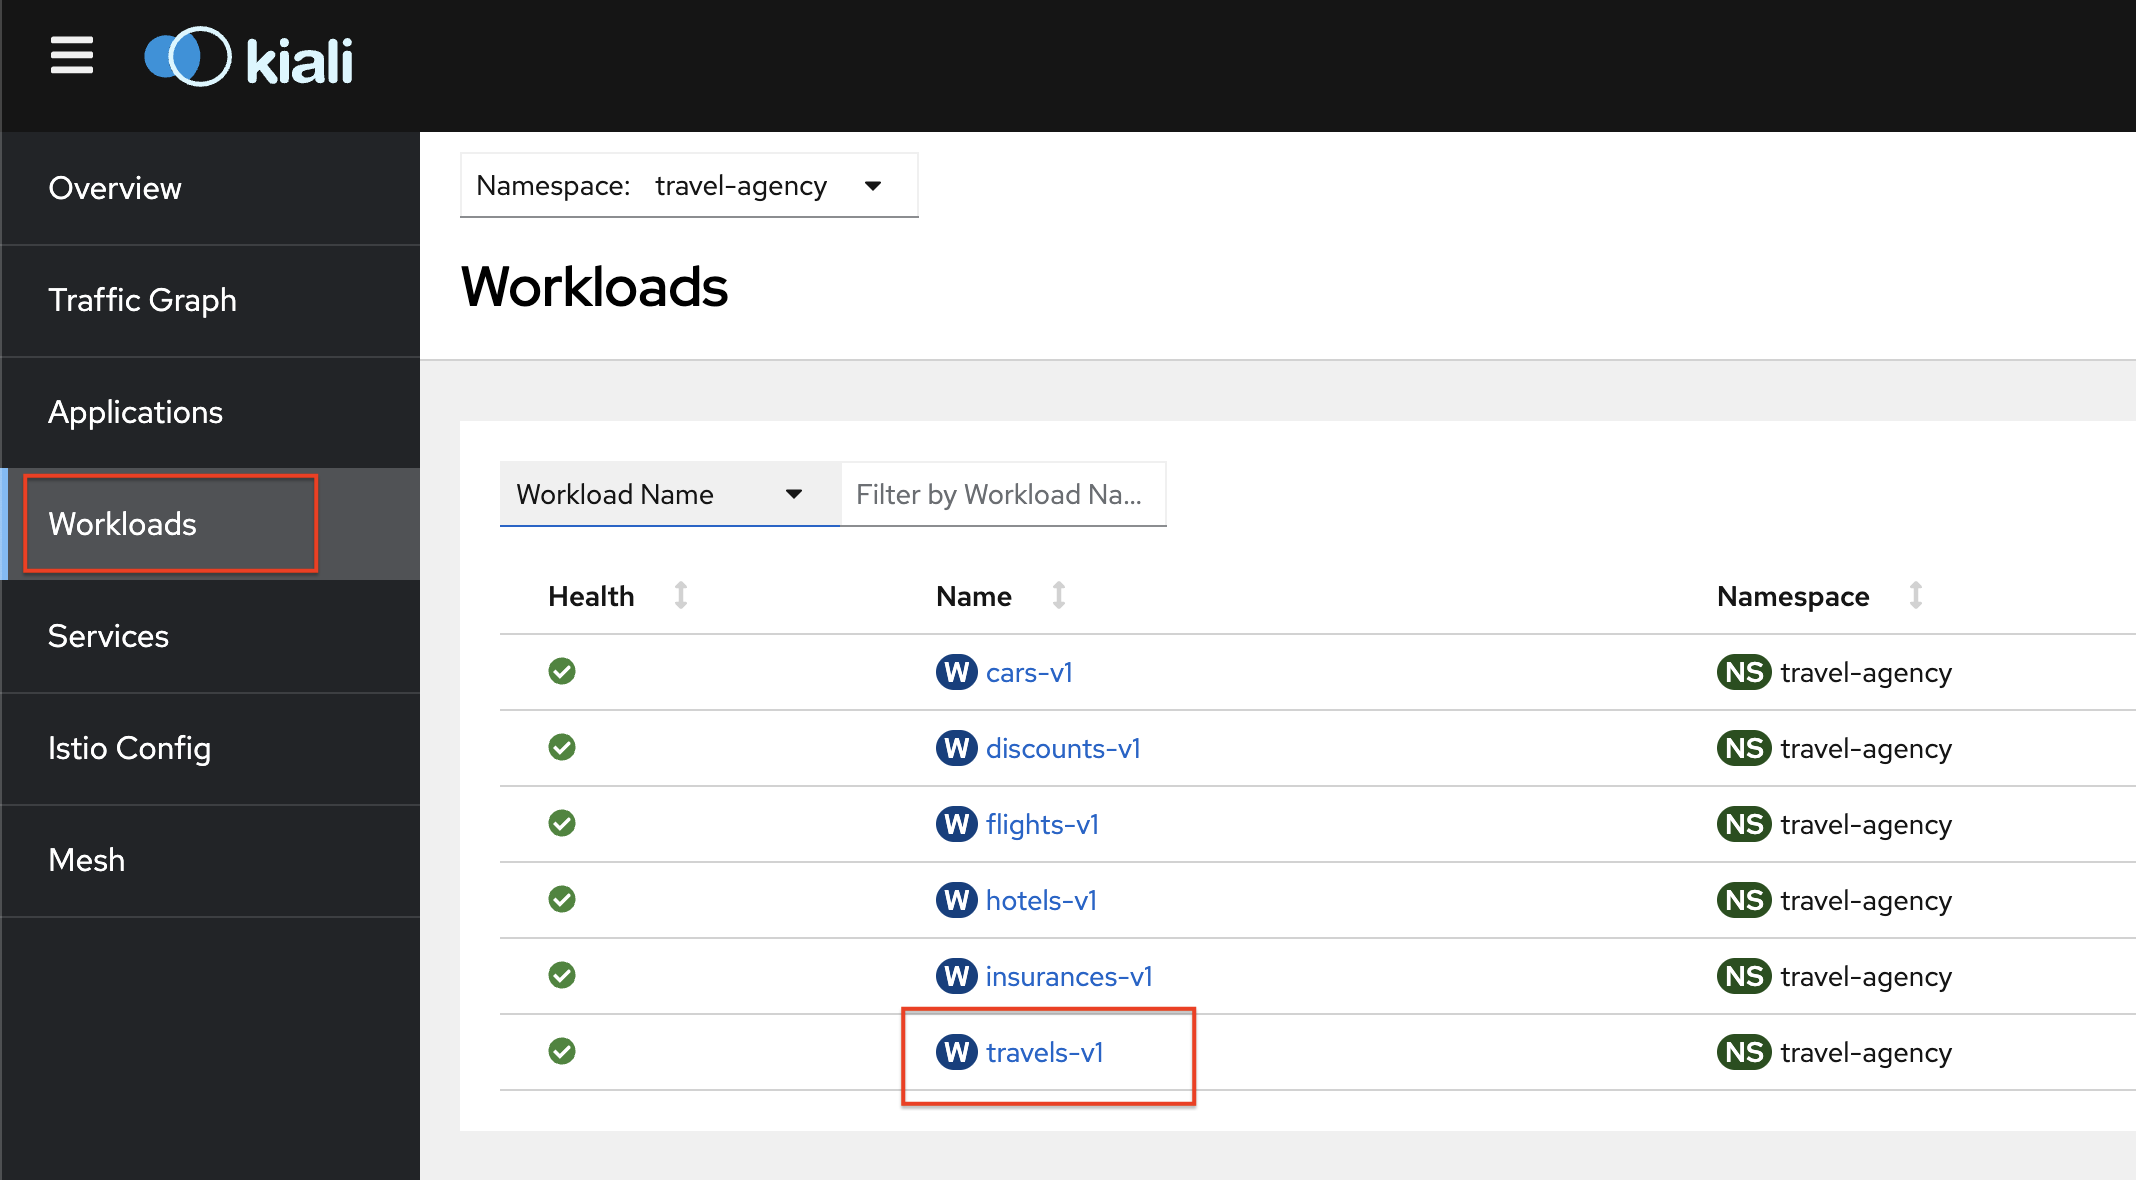
From the Kiali Console, navigate to the Workloads menu.
-
Select the
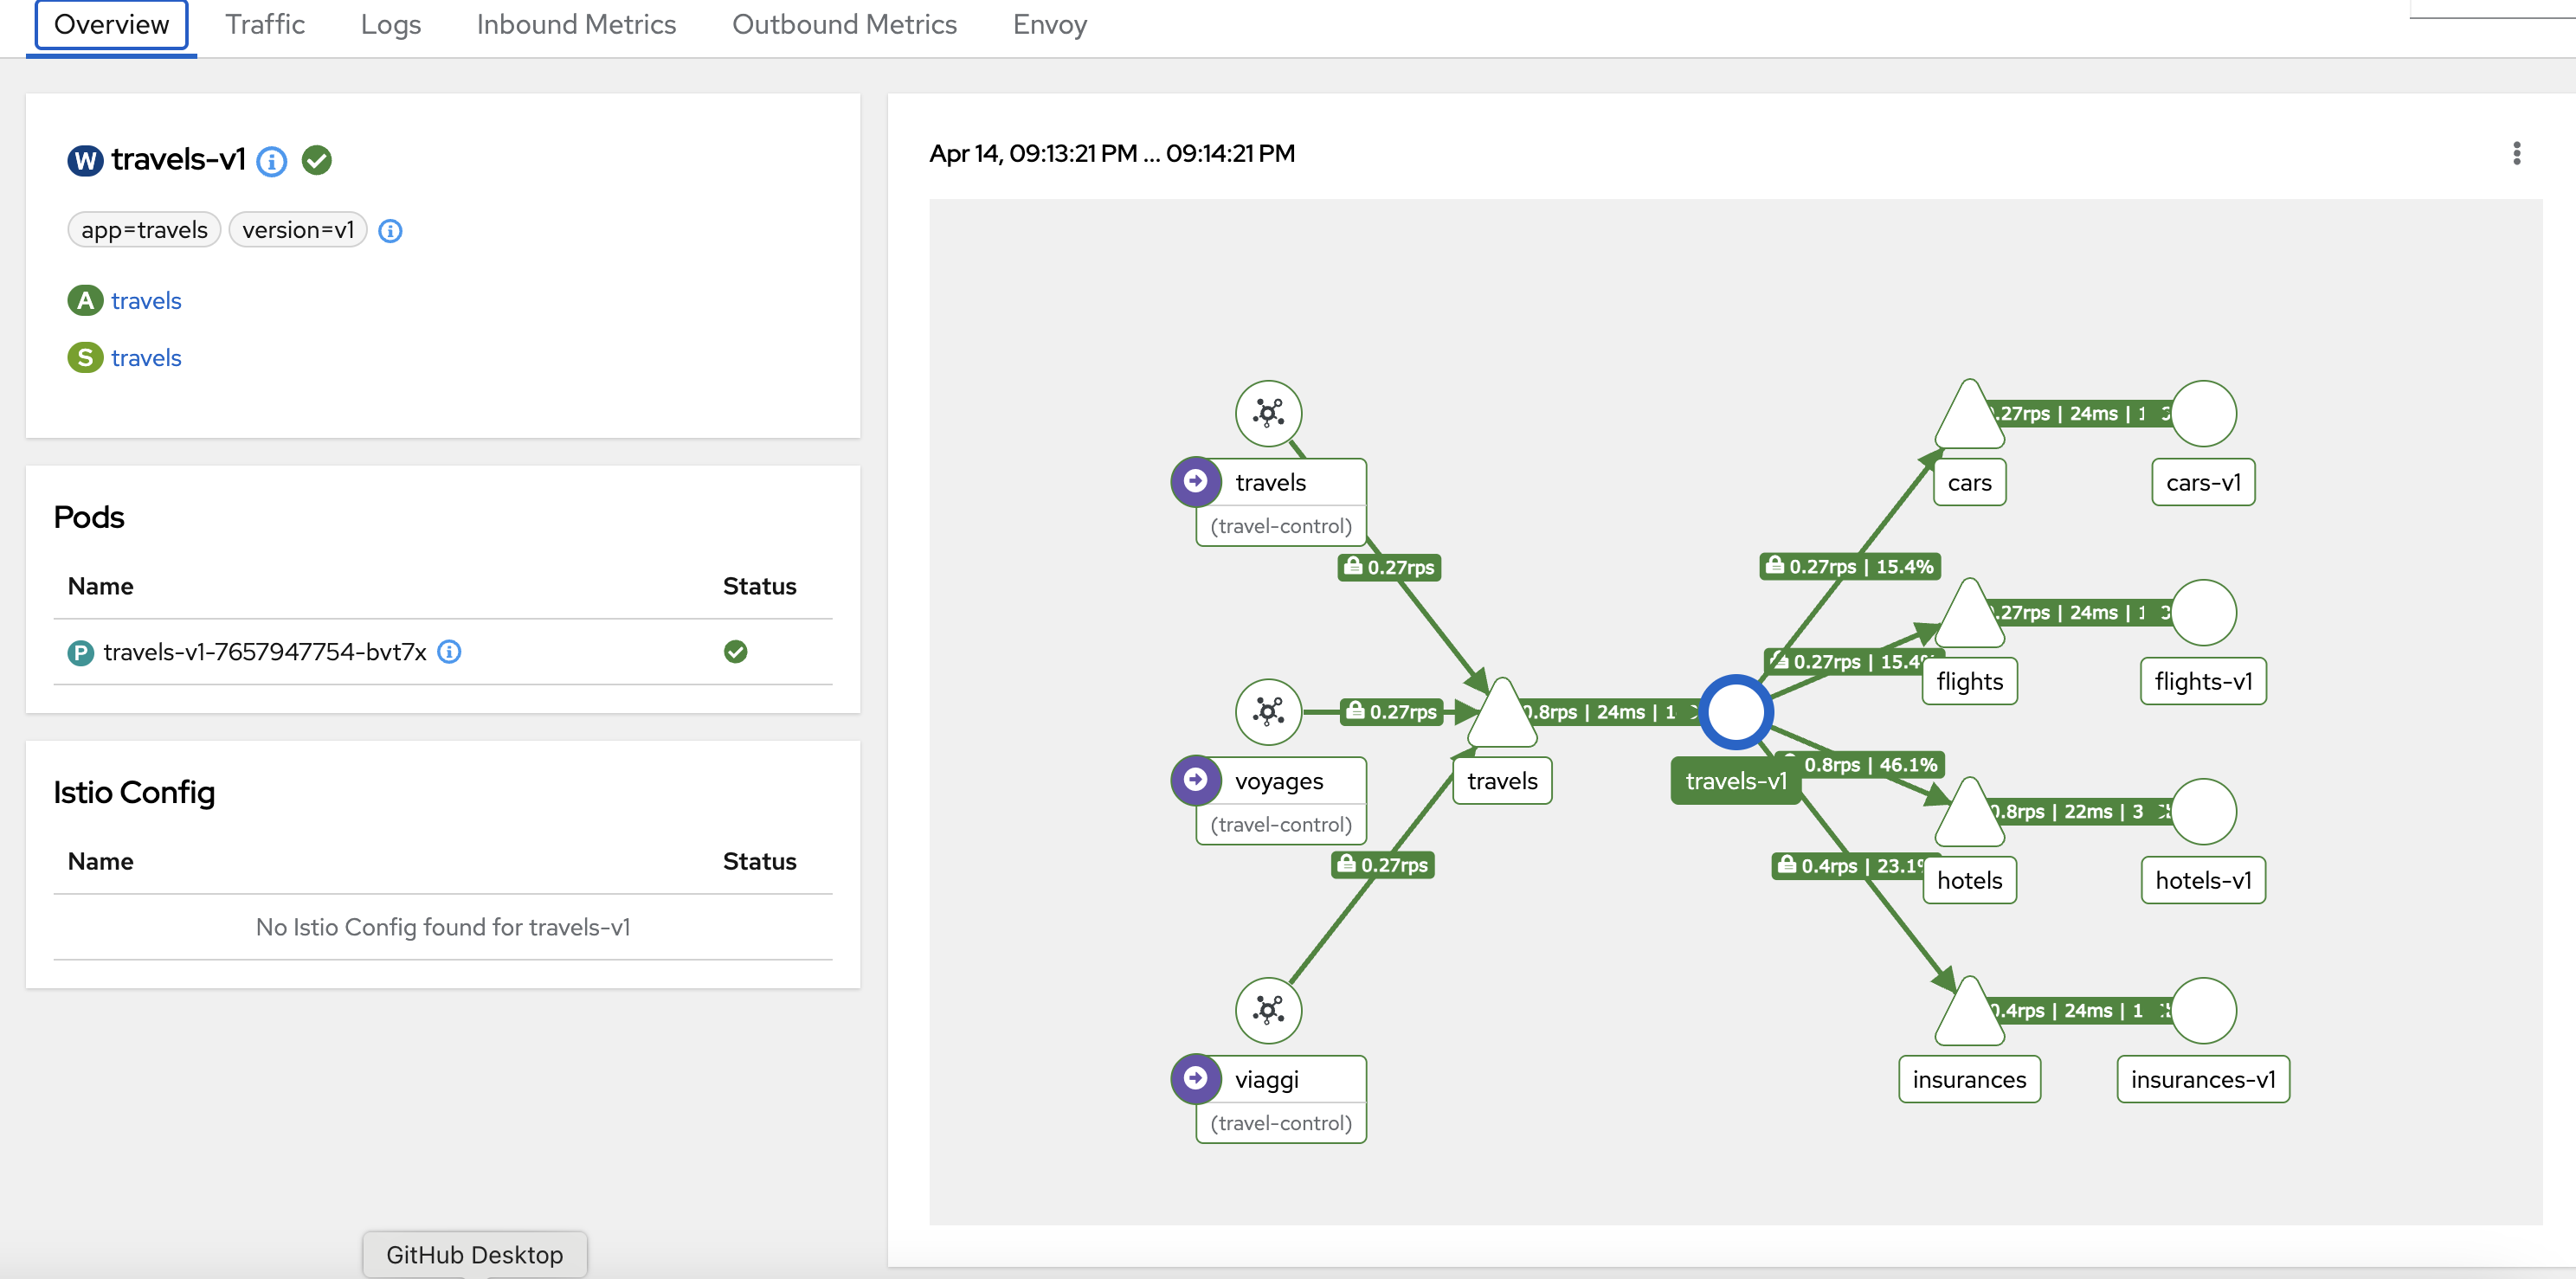
travels-v1workload to review the various metrics available. -
The Overview tab gives a high-level summary of the selected workload, including its health status and traffic metrics. It helps you quickly assess how a workload performs and interacts within the mesh.
Click to view the image in full screen.
Optional Activity: Detailed metrics exploration
If time permits, you can further explore the metrics offered.
Click to view: Detailed metrics exploration
-
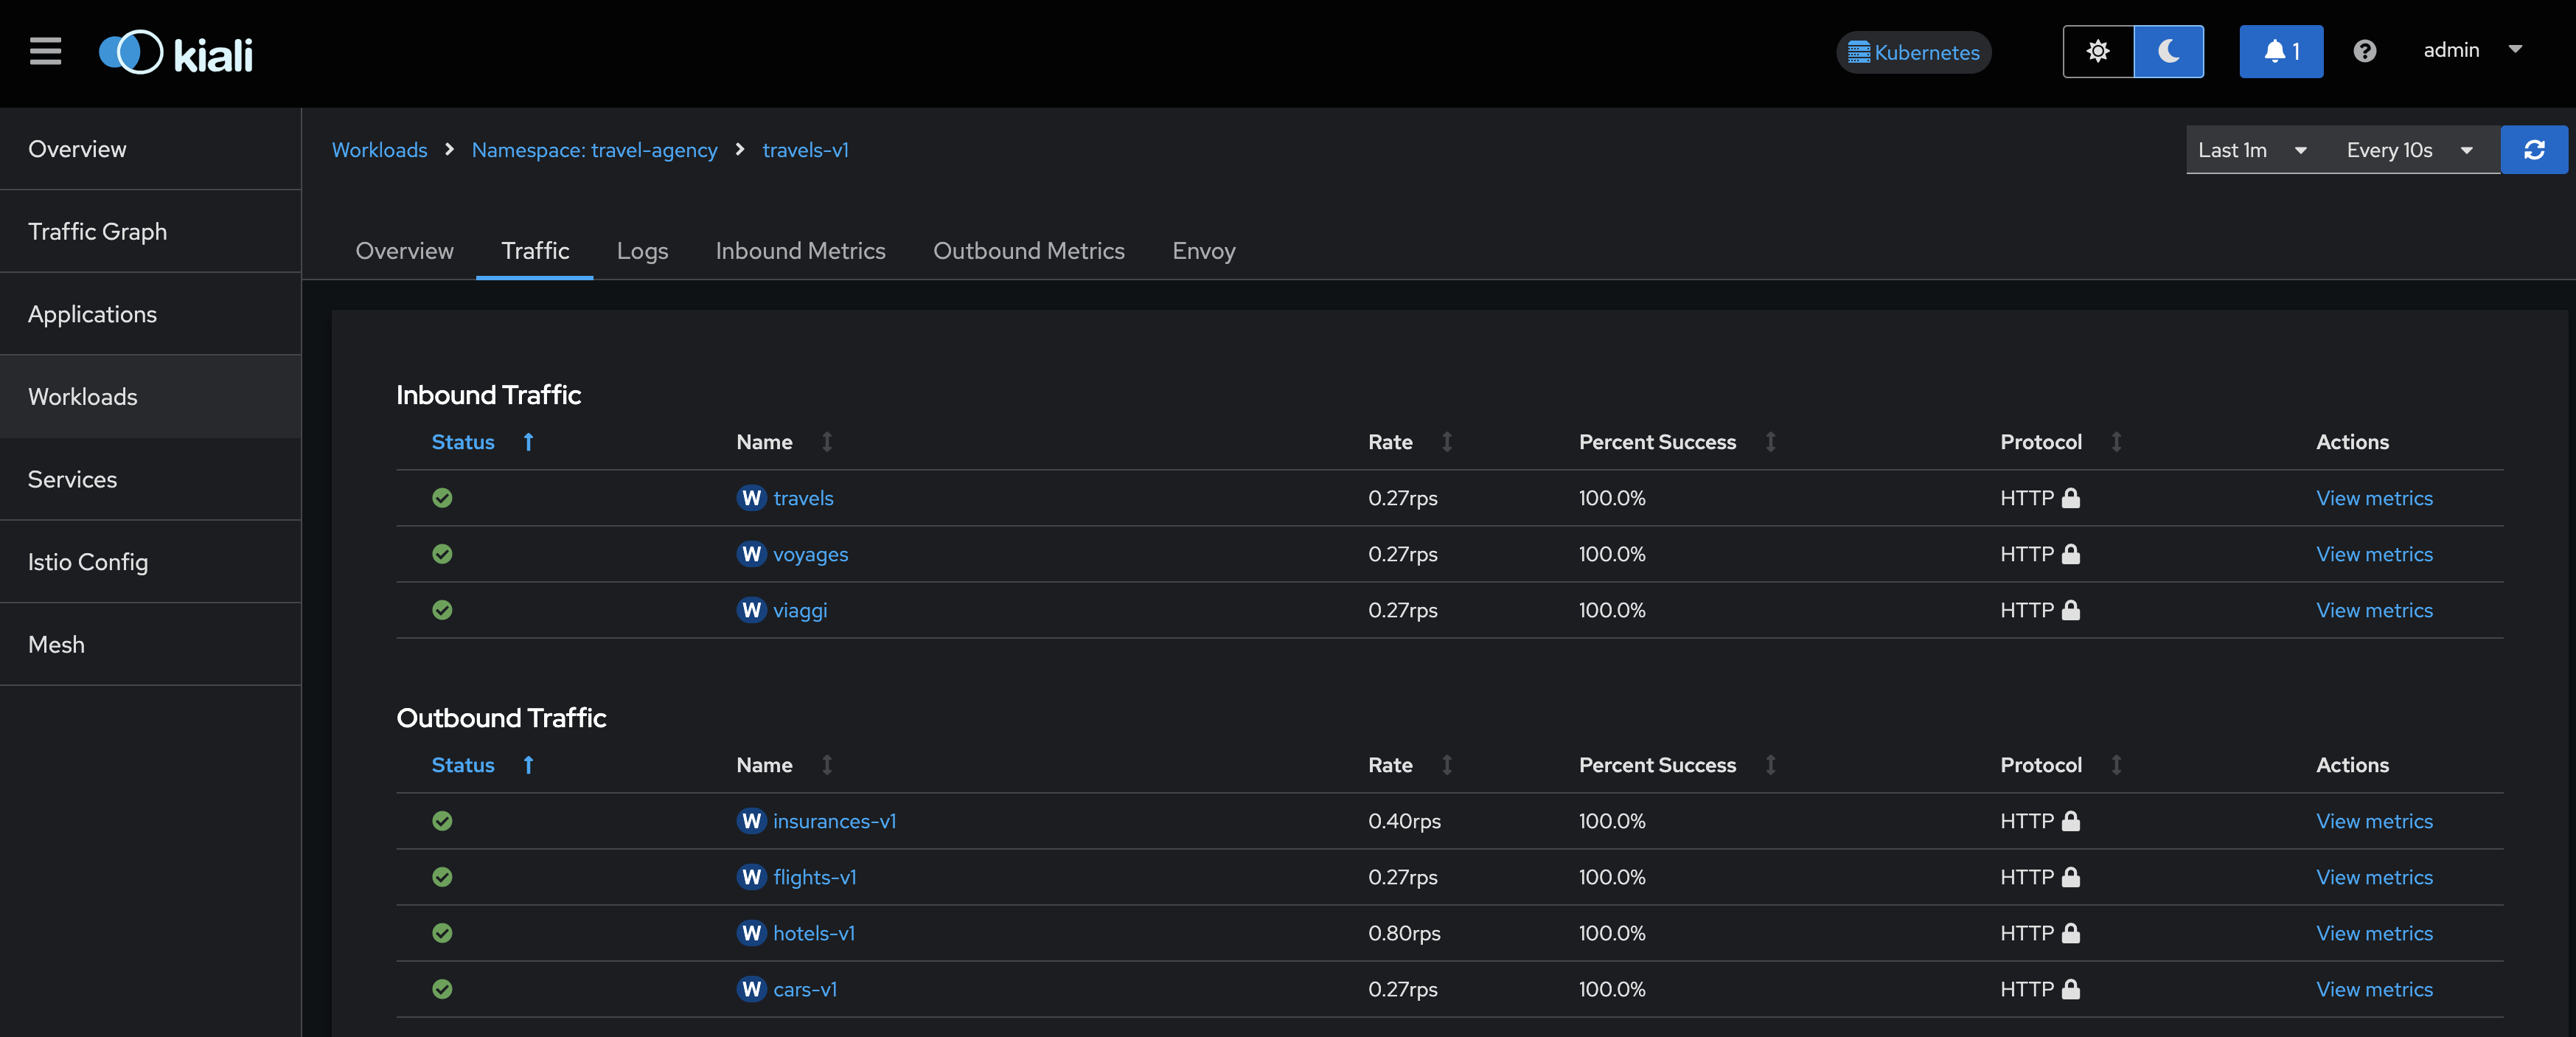
Traffic tab visualizes inbound and outbound traffic for the selected workload, showing real-time request rates, response codes, and latencies.
-
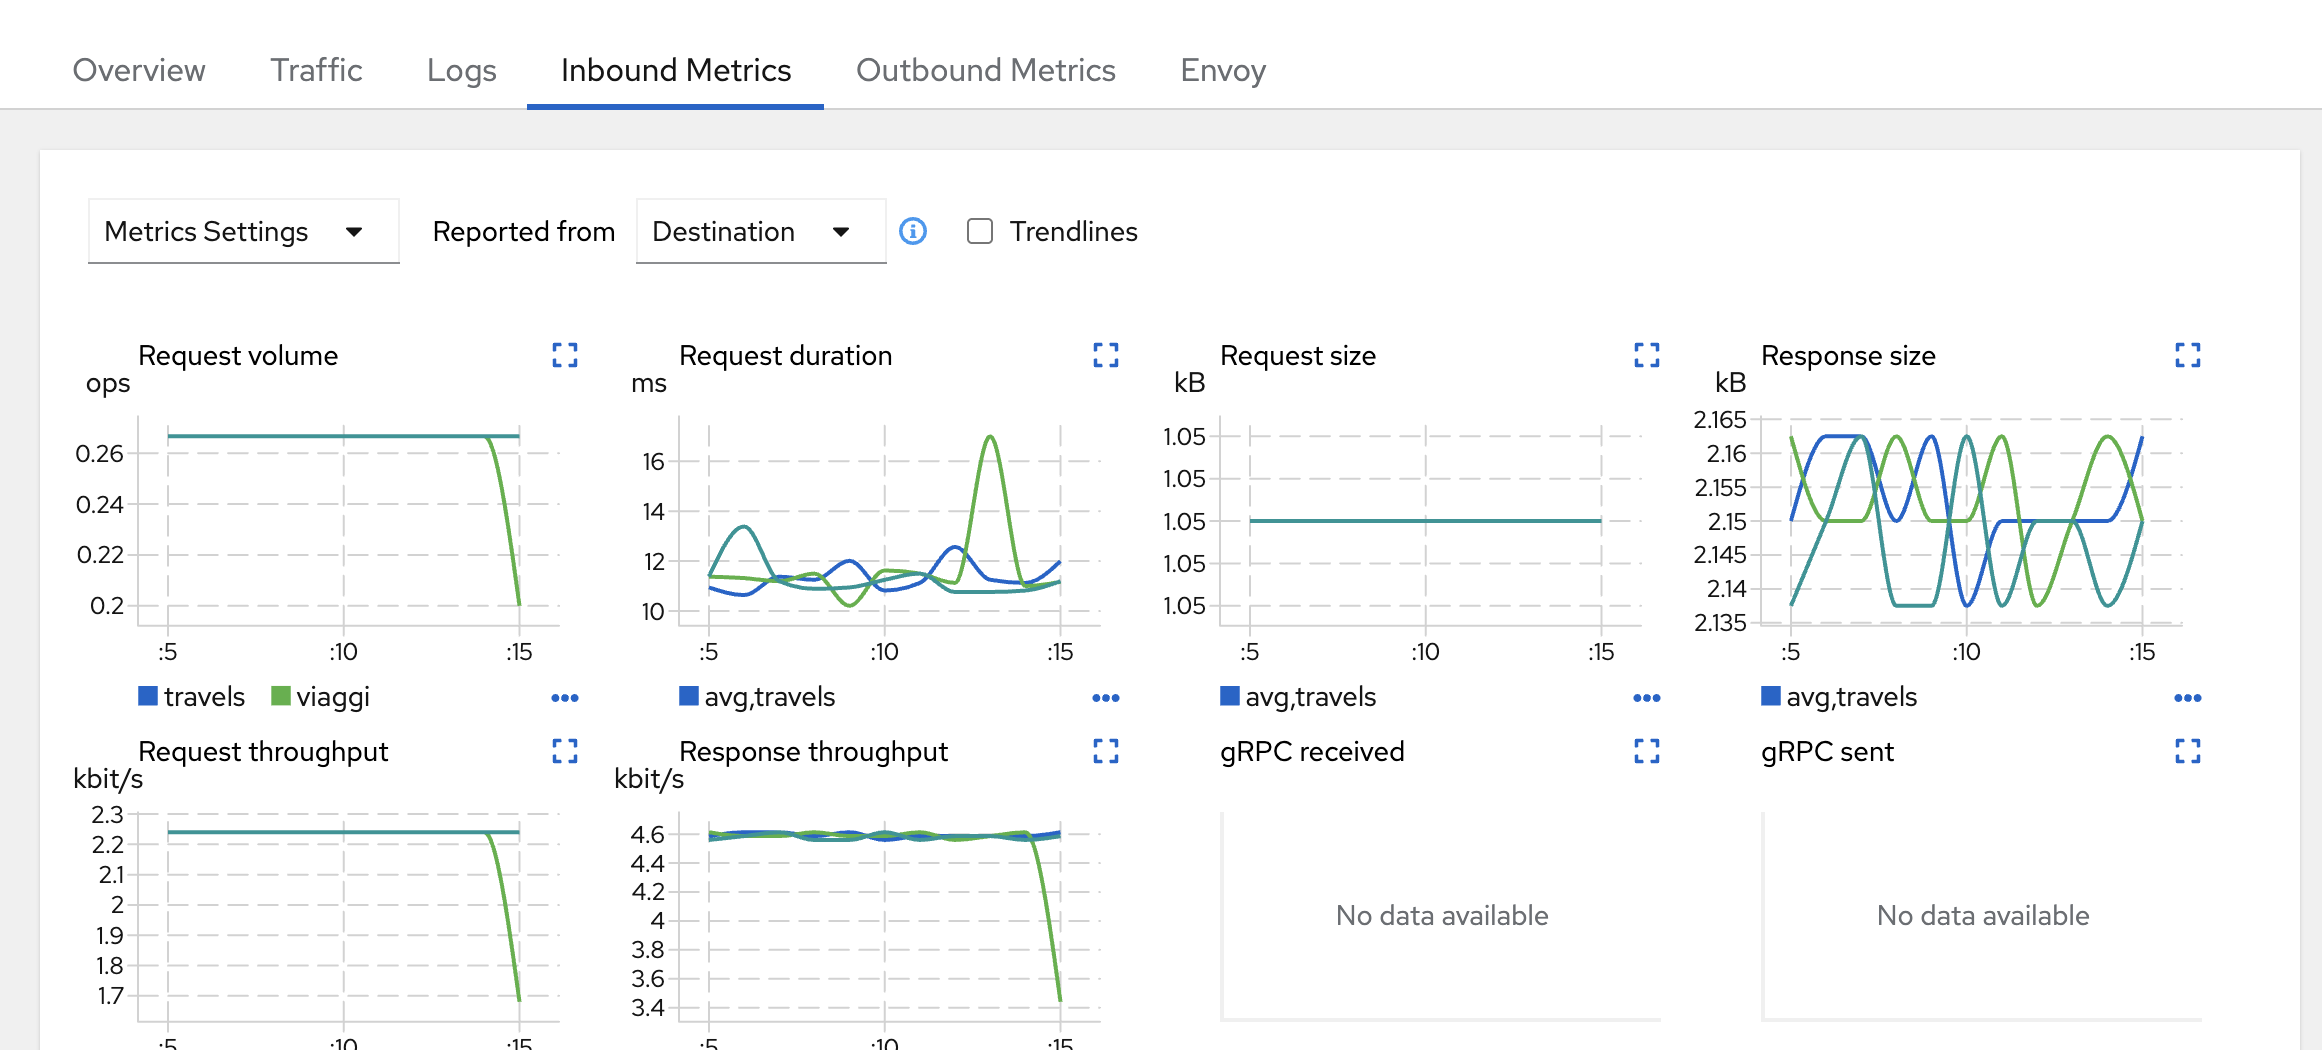
Inbound Metrics displays detailed telemetry for incoming traffic to the selected workload, including request rates, response times, and error rates.
-
Feel free to explore Logs, Outbound Metrics, Envoy, Services, Istio Config, and Mesh tabs as well.
